fbpx

Uncertainty In Gold Price Movement Amid Russia-Ukraine Tensions

Ever since the all-time high for Gold was reached in August 2020 at $2074 per ounce, the bears have been more active in $XAUUSD’s price action. Before the all-time high in 2020, there was high volatility in the price of gold. For example, the lowest price of $XAUUSD in August 2018, August 2019, and August 2020 were $1,160, $1,400, and $1,865 respectively.

Daily Chart

Since the all-time high in 2020, the price has maintained a support level at $1,677 even till now. The current resistance level is at $1,917 which has been active since 2021. As at August 2020 when the price of $XAUUSD reached an all-time high, RSI indicated that the price was overbought which possibly was the cause of the price dip at that time.

Weekly Chart

Since the beginning of 2022, Gold has rallied. This week, Gold hit $1,912, the highest point since the year 2022 began. It isn’t certain that Gold can keep up this rally for much longer as the rally is linked to investors’ panicky response to hedge their investments in precious metals, which are commonly considered to be safe havens during geopolitical crises.

Some of these ideas are in our clients’ portfolios. To understand if this one can work for you or for help to invest your own wealth, talk to our advisors at FM Capital Group. Would you like more information on how to get stocks and commodities in your portfolio? Schedule a meeting with us here.

Fastly Loses Big 

Fastly is an American cloud computing services provider, which is designed to help developers extend their core cloud infrastructure to the edge of the network, closer to users. The stock had its IPO in the spring of 2019. After surging in its debut and eventually doubling from its IPO price in the early fall, shares went down over 35% from their highs in the fourth quarter, putting many post-IPO investors in the red. $FSLY stock started trading at $21 per share. Fastly said it had sold 11.25 million shares at $21 each, raising $180 million. Fastly investors are back to the initial stage. 

Before the current downturn of Fastly, the IPO investors made over 6x since its IPO. The all-time high of Fastly was in October 2020 at $136.45.  The price of Fastly is currently trading at $20.27, a few points below the IPO price of $21.50. At the beginning of this week, $FSLY opening price was $27.70. Fastly has lost over 27% of its value from the beginning of the week. Until certain measures are taken before $FSLY share price could rally, though a gap-down has occurred which might be filled soon. Since the January 2021 monthly candlestick finished with a bullish one, only June and October monthly candlesticks finished on a bullish note, all other ones have been bearish. 

Some of these ideas are in our clients’ portfolios. To understand if this one can work for you or for help to invest your own wealth, talk to our advisors at FM Capital Group. Would you like more information on how to get stocks in your portfolio? Schedule a meeting with us here.
UNCHARTED Podcast: Episode 2

Part 1: Intro & Market Review
Part 2: USD and the impact of Inflation
Part 3: Market Movements and Forecasts

In this episode, we review the movements of the markets in the past week. We look into the possible causes of these movements and if these causes will linger on into this new week and further into the weeks to come. For instance, the sky-high inflation rates in the United States could have an even stronger impact on the U.S. dollar in the next couple of weeks than it’s having right now.

Here’s an outline of all we discussed:

  • Cryptocurrency market and the possible bull traps
  • Bitcoin dipping to $29,000. Read more here.
  • Forces moving the commodities market
  • How bears may overcome bulls in the Crude Oil market. Read more here.
  • USD and the impact of Inflation
  • S&P 500. Read more here

Some of these ideas are in our clients’ portfolios. To understand if this one can work for you or for help to invest your own wealth, talk to our advisors at FM Capital Group. Would you like more information on how to get currencies and stocks in your portfolio? Schedule a meeting with us here.
The Loonie Might Appreciate Against The Buck

At the beginning of the global lockdown in 2020, the bucks gained massively against the Canadian dollar as prices moved from the ranging market between 1.29582 and 1.33864. This price range was before the lockdown, which lasted for more than 6 months. A breakout of the range occurred in February when the price rallied to 01.46710. That rally was about 150pips. The price of $USDCAD was last reached 1.46710 in January 2016 until the rally before the lockdown. After the lockdown easing, the loonie gained against the dollar which made the price reach 1.20193 in June 2021 after 6 years. 

Monthly Chart


As the $USDCAD maintains support at 1.20103 since last year, a bounce has occurred as the price reached 1.29658 from the support level. Though RSI shows price has been oversold, the bears could still push lower to 1.24754 from its current 1.27472. RSI  shows the price has been oversold on the 4hr Chart. Looking at the monthly time frame, the price has been ranging for about 6 months with the bulls more active. The bears might take charge in the next trading days. 

4hr Chart

Some of these ideas are in our clients’ portfolios. To understand if this one can work for you or for help to invest your own wealth, talk to our advisors at FM Capital Group. Would you like more information on how to get currencies and stocks in your portfolio? Schedule a meeting with us here.

Lyft Bounces From Support Level


All of Lyft’s profits gained in 2021 were lost before the end of the year. Despite the bullish ride from October to March 2021, the bears overpowered bulls as the share price slumped to $34 from the March 2021 high at $68.  The lowest price for Lyft was at $15 which occurred in March 2020 during the global pandemic. The only time Lyft traded above the IPO price was April 1, 2019, the same day it was listed on the stock exchange. Lyft’s IPO price was $72 valuing the company at $20.5 billion. 

Daily Chart

Lyft investors post IPO have never had a reason to smile to the bank since most part of the time it has been listed on the stock exchange, it fails to trade above the IPO price. The next rally could push the price to a new resistance in the year 2022 at $55 as the price is currently trading at $41.20. The recent bounce is a result of LYFT’s Q4 earnings reports, as price rallies. The revenue rose to $969.9 million from $569.9 million from the previous quarter.  Analysts estimated revenue of $940.07 million. RSI on the daily chart already shows the price has been oversold in December, as the price is currently in the upper region of the Bollinger bands. 

Weekly Chart

Some of these ideas are in our clients’ portfolios. To understand if this one can work for you or for help to invest your own wealth, talk to our advisors at FM Capital Group. Would you like more information on how to get stocks in your portfolio? Schedule a meeting with us here.

Meta Share Slumps, The Worst Day Fall For Any Stock

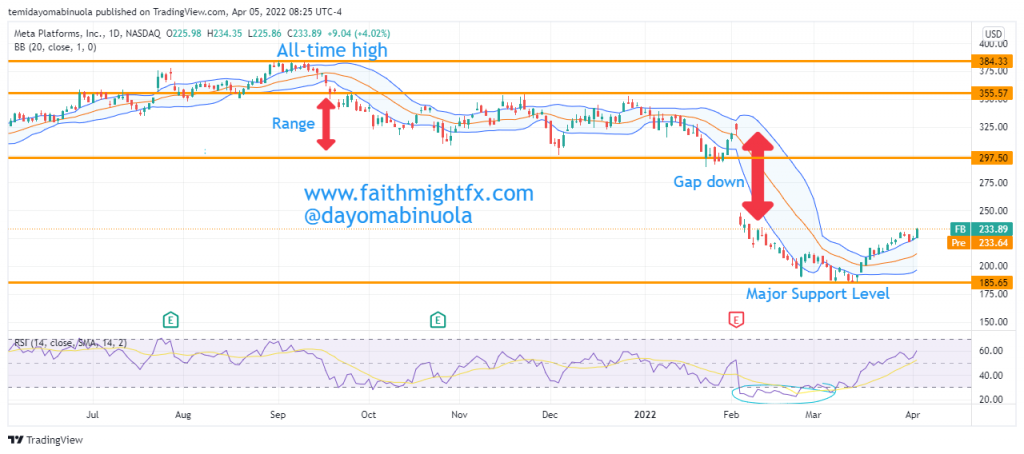
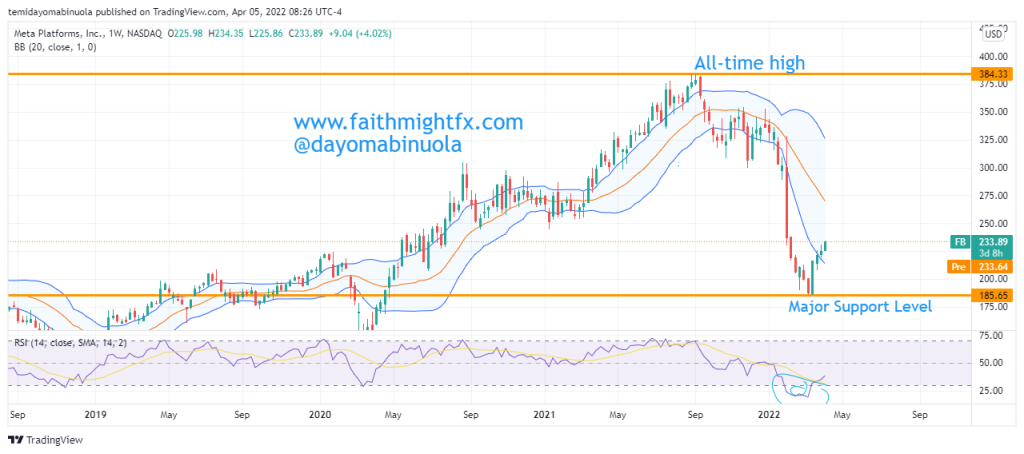
The Facebook parent company, Meta Platform Inc plunged 26% last week Thursday after the release of poor earnings results. About $251.3 billion in market value was wiped out, making it the biggest daily loss for any U.S. company ever. As a result of this fall, Mark Zuckerberg lost over $30 billion. This massive fall of Meta made other tech stocks fall, the likes of Twitter, Snap, and Pinterest.

Weekly Chart

In the year 2021, the opening price of Meta was $274.79 and closed at $332.46. The appreciation in price put smiles on the faces of investors. Now, the reverse is the case this year. The opening price of the Meta stock was $338.26 but now the price is at $237.01, which is a 30% loss from the year’s opening price. Long-term investors have nothing to fear about the most recent dip in the price of Meta. In the coming weeks, the price could rally to $381, which will eventually lead to a new all-time high.  There was a gap down when the market opened last week Thursday as a result of the earnings report. On Friday, Meta’s loss increased because of the continued bearish turn, but at the end of the trading day, there was a rally that formed a Doji. RSI using the daily time frame shows that price has been oversold, which could lead to a possible reversal.

Monthly Chart

Some of these ideas are in our clients’ portfolios. To understand if this one can work for you or for help to invest your own wealth, talk to our advisors at FM Capital Group. Would you like more information on how to get stocks in your portfolio? Schedule a meeting with us here.
S&P500 Bounces After The January Dump

A huge selloff has occurred in the price of $SPX since the beginning of this year after the market opened on the first trading day of the year at $4784.65. On the second trading day which was on the 4th of January, the price reached a new all-time high at $4817.87. The bearish confirmation was on the year’s third trading day after $SPX lost over 80 points in a day.  The month of January was bearish for $SPX after its loss of over 260points, which was almost a 6% loss from the year’s opening price of $4776.61. Just like the American market, the European and the Chinese markets had a poor January as the market was majorly bearish. In January, $SPX had the worst month since March 2020. Our analysts forecasted the price drop of $SPX in one of our articles in January 2022.

4hr Chart

The sell-off in January was due to the Fed signaling its readiness to tighten monetary policy, including raising interest rates multiple times this year to tame inflation that has shot up to the highest level in almost 40years. The $SPX has been a bull market over the decades. The sell-off in January was a normal correction expected in a bull market. The correction of $SPX made the price hit the lowest price in January at $4221.07. A bounce from the dip occurred in the last week of January as a Doji was formed, which could lead to the beginning of price recovery. The bulls are beginning to gather momentum as the price closed at $4505.15, about 7% price appreciation from the January low. As the bulls begin to become more active, the price could reach $4805.68 in the coming weeks. Price has currently crossed to the upper region of the Bollinger bands on the 4hr chart. 

Weekly Chart

In the 12 months of 2021, $SPX had a new all-time high in each of them. $SPX has continued with a new all-time high in January before the dump. Will a new all-time be reached in February?

Some of these ideas are in our clients’ portfolios. To understand if this one can work for you or for help to invest your own wealth, talk to our advisors at FM Capital Group. Would you like more information on how to get venture capital in your portfolio? Schedule a meeting with us here.
ON THE AIR with Dantes Outlook Podcast

On this podcast, MD of FM Capital Group, Lydia Idem, was interviewed by Damanick Dantes, host of Dantes Outlook. She spoke on how she got into the Financial Services world and how FM Capital Group came to be and the services it offers. She also shared some insights on venture capital investing and the emerging markets in Africa and Latin America.

Part 1
Part 2

If you prefer to listen to the full interview on Dantes Outlook platform, click here.


Some of these ideas are in our clients’ portfolios. To understand if this one can work for you or for help to invest your own wealth, talk to our advisors at FM Capital Group. Would you like more information on how to get stocks, forex, or venture capital in your portfolio? Schedule a meeting with us here.
Microsoft Appreciates After Earnings Report

Microsoft reported earnings beat analyst expectations. The earnings per share came in above what analysts had forecast, rising 22.2% year over year. Revenue also surpassed analyst estimates, up 20.1% compared to the same quarter one year ago. Microsoft’s opening price at the beginning of 2022 was $335.87. The price has since fallen to $296.71, making it the worst monthly fall ever. That is an 11% decline since the beginning of the year.

Daily Chart

Furthermore , the company’s shares fell as much as 5% in post-market trading on Wednesday. Over the past year, Microsoft’s shares have made a return of 26.7%. The share price of $MSFT reached an all-time high at $349.69 in November 2021. Before the global market tanked a few days ago, the price had been ranging since that all-time was reached. The price of $MSFT reached $276.02 on the 24th of this month before a price correction. The last time price of Microsoft was at the $276.02 level per share was back in July.

15mins Chart

The 15mins time frame is showing that an inverted head and should pattern is about to form, which, in the long run, leads to a massive bullish run. In the next few days, the price should fall to complete the head and shoulder. If this is completed, the price could reach $339.98. The market opened yesterday after a gap-up but closed on a bearish note. The global market has been very bad this week. The next rally might just be what investors have been waiting for since the holidays are over. The RSI daily chart already shows that the price has been oversold. This could be the indication the bulls are expecting.

Some of these ideas are in our clients’ portfolios. To understand if this one can work for you or for help to invest your own wealth, talk to our advisors at FM Capital Group. Would you like more information on how to get stocks in your portfolio? Schedule a meeting with us here.
OUR INVESTMENT IN HAIRTELLIGENCE

It was a busy year for us as at FM Capital Group in 2021. From an investment perspective, it was our busiest year to date for our small team of investors. We saw many more investment opportunities than we had in the past which let us put money to work at a faster clip than in 2020. Hairtelligence was one of those few that we selected for investment. You will soon understand why.

I met the women of Hairtelligence a bit skeptical of the business. They manufacture wigs using artificial intelligence (AI). Ok. But what I couldn’t appreciate from reading the deck initially is the economics involved when AI is introduced to the manufacturing value chain. The costs are reduced so dramatically in an industry that has seen very little price disruption in the supply chain. They can deliver high-end, custom wigs to anyone at mass retail prices. The use of AI to disrupt the market with custom wigs starts with the customer experience. Customers can get a custom fit using the Hairtelligence online application. Long term, using AI throughout the customer experience positions Hairtelligence as a serious player in datasets of diverse women.

Isoken Igbinedion, Ifueko Igbinedion, Marlyse Reeves, Simone Kendle

Led by the formidable Isoken Igbinedion, the founders are leading the way in disrupting an age-old business. The hair business has had human capital at the heart of its manufacture for centuries. From sourcing the hair to threading the wig to styling and installation, the hair business has human hands involved. By removing as many of those hands as possible, the cost to make the wig drops pretty dramatically. Now it becomes possible for more women to access high-quality hair options. And this is big business. Hair is a $100 billion business globally and Black women are the #1 consumer spending 9 times more on hair care than any other demographic. Who is better positioned to manufacture wigs than the very consumers of those wigs?

Our ability to see the innovation for what it is before it was built speaks to the quality of investors that we work with. We moved quickly once our discussions made the opportunity very clear for us. It took 3 discussions with the team and 2 discussions amongst ourselves to get us through due diligence. We closed in September and our first investor update informed us that Serena had followed us with a subsequent investor. To say that Serena Williams and I are co-investors is kind of dope. And when she wears that hair at Wimbledon, don’t be surprised if its one from Hairtelligence. The product launched in December and customers are raving about it. Follow @hairtelligence to see the products and hear testimonials from a growing cadre of satisfied customers. This investment was our last of 2021 but it has already given us the most upside appreciation in that short time. I look forward to the future, helping them break into more markets beyond the US.

Great work Hairtelligence Team!


Some of these ideas are in our clients’ portfolios. To understand if this one can work for you or for help to invest your own wealth, talk to our advisors at FM Capital Group. Would you like more information on how to get venture capital in your portfolio? Schedule a meeting with us here.