Blog

  • OUR INVESTMENT IN HAIRTELLIGENCE

    It was a busy year for us as at FM Capital Group in 2021. From an investment perspective, it was our busiest year to date for our small team of investors. We saw many more investment opportunities than we had in the past which let us put money to work at a faster clip than in 2020. Hairtelligence was one of those few that we selected for investment. You will soon understand why.

    I met the women of Hairtelligence a bit skeptical of the business. They manufacture wigs using artificial intelligence (AI). Ok. But what I couldn’t appreciate from reading the deck initially is the economics involved when AI is introduced to the manufacturing value chain. The costs are reduced so dramatically in an industry that has seen very little price disruption in the supply chain. They can deliver high-end, custom wigs to anyone at mass retail prices. The use of AI to disrupt the market with custom wigs starts with the customer experience. Customers can get a custom fit using the Hairtelligence online application. Long term, using AI throughout the customer experience positions Hairtelligence as a serious player in datasets of diverse women.

    Isoken Igbinedion, Ifueko Igbinedion, Marlyse Reeves, Simone Kendle

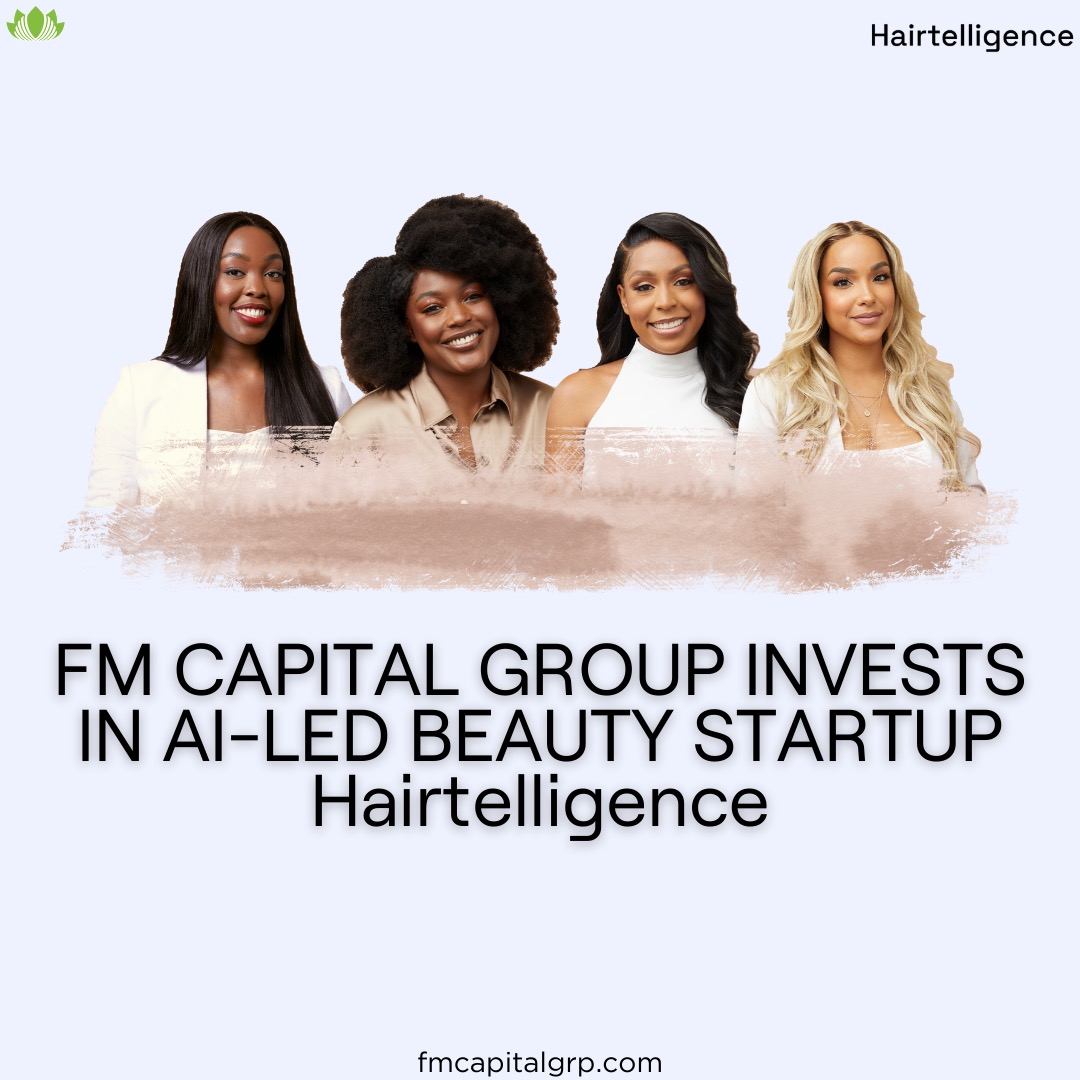
    Led by the formidable Isoken Igbinedion, the founders are leading the way in disrupting an age-old business. The hair business has had human capital at the heart of its manufacture for centuries. From sourcing the hair to threading the wig to styling and installation, the hair business has human hands involved. By removing as many of those hands as possible, the cost to make the wig drops pretty dramatically. Now it becomes possible for more women to access high-quality hair options. And this is big business. Hair is a $100 billion business globally and Black women are the #1 consumer spending 9 times more on hair care than any other demographic. Who is better positioned to manufacture wigs than the very consumers of those wigs?

    Our ability to see the innovation for what it is before it was built speaks to the quality of investors that we work with. We moved quickly once our discussions made the opportunity very clear for us. It took 3 discussions with the team and 2 discussions amongst ourselves to get us through due diligence. We closed in September and our first investor update informed us that Serena had followed us with a subsequent investor. To say that Serena Williams and I are co-investors is kind of dope. And when she wears that hair at Wimbledon, don’t be surprised if its one from Hairtelligence. The product launched in December and customers are raving about it. Follow @hairtelligence to see the products and hear testimonials from a growing cadre of satisfied customers. This investment was our last of 2021 but it has already given us the most upside appreciation in that short time. I look forward to the future, helping them break into more markets beyond the US.

    Great work Hairtelligence Team!


    Some of these ideas are in our clients’ portfolios. To understand if this one can work for you or for help to invest your own wealth, talk to our advisors at FM Capital Group. Would you like more information on how to get venture capital in your portfolio? Schedule a meeting with us here.

  • Western Union Investors Are Having A Relief

    The Western Union Company is a leader in cross-border, cross-currency money movement and payments. The share price of Western Union nosedived from April 2021 at $26.55 to reach a new low at $15.67 since October 2014. Just like many other stocks, $WU share price fell from a price level at $28.44 to $17.44 during the lockdown in 2020. The ease of lockdown from 2020 to the year 2021 made the price rally reach $26.64, a few points from the 2020 resistance level at $28.44. All Western Union profits made in 2021 were lost as a result of the price dip to $15.67.

    Weekly Chart

    A bounce from the support level at $15.67 started at the end of 2021. The $WU market closed yesterday at $18.77, which is a 17% rally. Whether price continues to rally or continue the fall is a major concern for the $WU investors. Since the price rallied above $15.67 in the year 2013, which is now the support level, the price is yet to close below it. Towards the end of last year, Western Union announced Devin B. McGranahan as the new Chief Executive Officer after Hikmet Ersek announces retirement at the end of 2021. The new CEO was able to appoint the new Board of Directors. Investors are hopeful that the appointment of the new CEO will bring about growth in the company’s share price.

    Daily Chart

    The Weekly Chart shows price is oversold on the RSI but still maintains the lower region of the Bollinger bands. $WU has a loss of 19% from 2021’s opening price. Nevertheless, the share price of $WU has been ranging since the beginning of this year. The price might drop to $16.16 if issues around sanctions continue among the world powers, as payments may be delayed and the cost of international payments might be increased. Later in the year, the price could appreciate to $25.16.

    Some of these ideas are in our clients’ portfolios. To understand which ones can work for you or for help to invest for your own wealth, talk to our advisors at FM Capital Group. Would you like more information on Investment Advisory, Portfolio Services, and VC? Schedule a meeting with us here.

  • Robinhood Trades Below IPO price

    Robinhood opened at an IPO price of $38 and was valued at $32 billion on the 29th of July, 2021. $HOOD only rallied for a few days after its IPO to reach an all-time high on the 4th of August 2021 at $85.10. The first 5 trading days were the best days for $HOOD investors. Price closed yesterday at $15.17, making it the worst close since its launch on NASDAQ in July 2021. $HOOD has lost 56% in value from the IPO since it currently trades lower than the IPO price of $15.17. This is a huge disaster for Robinhood investors. The current market cap of $HOOD is $12.67 billion. Since its launch in the stock exchange at IPO price to date, $HOOD has lost $25.33 billion. Robinhood has only been trading in the exchange for just 7months.

    Daily Chart

    Before its IPO, the company had seen massive growth despite the pandemic. Many first-time investors who were given stimulus checks invested in the stock market using Robinhood. As at that time, Robinhood had more than 18 million accounts and 17.7 million active monthly users. Robinhood had 22.5 million active users in 2021. On the daily chart, RSI has shown that the price has been oversold since November 2021. There have been many complaints from Robinhood customers over the inability to place a sell order or to a close position despite losses. We are hoping $HOOD doesn’t get to the point of being delisted from the NASDAQ.

    4hr Chart

    Some of these ideas are in our clients’ portfolios. To understand which ones can work for you or for help to invest for your own wealth, talk to our advisors at FM Capital Group. Would you like more information on Investment Advisory, Portfolio Services, and VC? Schedule a meeting with us here.

  • Virgin Galactic’s Price Falls To IPO, Loses Big

    Virgin Galactic is an American spaceflight company founded by the Billionaire, Richard Branson with its headquarter in California, USA and operates from New Mexico. The company is developing commercial spacecraft and aims to provide suborbital spaceflights to space tourists. It had its IPO in the NYSE in September 2017 with the price at $10.15. The price was stable till October 2019, when the price fell a bit to $6.98. This price correction led to a huge rally in price to the all-time high before the global lockdown at $42,64. During the lockdown, the price fell to $9.18 which was about an 80% loss in value, the price recovery moved the price to $63.25.

    Daily Chart

    On 11 July 2021, Branson and three other employees rode on a flight as passengers, making them the first to travel on his own ship into outer space (according to the NASA definition of outer space beginning at 50 miles above the Earth). Since this event, $SPCE has lost about 50% in value. The share price was expected to rally, but the price continued to fall since the first flight.

    Weekly chart

    Regular paid passenger service flights have been scheduled to begin this year 2022 after two more test flights have been completed. The share price has fallen from the all-time high at $62.50 to $10.14, which is approximately an 84% loss.  The current price is at $10.14  which is very close to the pandemic lowest price was at $9.05.  The share price might rally as $SPCE prepares passengers flights this year. The rally might reach $43.49, which is about 3X of the current price at $10.14. On the weekly chart, price is still at the lower region of the Bollinger bands and RSI gives no indication of the price being oversold. On the other hand, the Daily chart has multiple indications that the price has been oversold.

    Some of these ideas are in our clients’ portfolios. To understand which ones can work for you or for help to invest for your own wealth, talk to our advisors at FM Capital Group. Would you like more information on Investment Advisory, Portfolio Services, and VC? Schedule a meeting with us here.

  • Coca-Cola Reaches An All-Time High


    Since Coca-Cola acquired BodyArmour, the share price has continued to appreciate in value, which was spot on according to our analysts. Coca-Cola is one of the very few companies that has existed for 100years and the share price keeps rallying.  According to Coke, Fresca is surging in popularity recently, as the fastest-growing soda trademark in the beverage giant’s U.S. portfolio. Coca-Cola has seen a reason to team up to create ae alcoholic Fresca cocktails. The previous all-time high of $KO was at $60.15 which was February 2020. 

    Daily Chart

    Since the previous all-time high was reached at $60.15, the price of Coca-Cola fell by almost 50%, which was a result of the global lockdown. Since the ease of the lockdown, the appreciation has occurred gradually till it surpassed the $60.15. A new all-time was reached on the 5th of January, 2022 at $61.15. On November 4, 2021, our article on the acquisition of Body Armour shows that price could rally, price has eventually rallied. Will Coca-Cola, a non-alcoholic company teaming up with an alcoholic company like Fresca should be a reason for a price drop in the value of Coca-Cola?

    1hr chart

    This might be a reason our analysts are forecasting the price to drop to $53.90, which is about a 10% dip in price. Or could be it a result of Coca-Cola CEO James Quincey in October 2020 getting rid of beloved beverages. This means he was killing off half the company’s portfolio. Since the beginning of this year, the all-time high has been reached, the price has been ranging, which shows consolidation. On the daily chart, RSI still shows price has been overbought as the price maintains the upper region of the Bollinger bands. Though the bulls took over from the bears in December 2021, there are indications the bears are gathering momentum. 

    Some of these ideas are in our clients’ portfolios. To understand which ones can work for you or for help to invest for your own wealth, talk to our advisors at FM Capital Group. Would you like more information on Investment Advisory, Portfolio Services, and VC? Schedule a meeting with us here.

  • Microsoft Bounces From The Year’s Support

    After the all-time high of Microsoft was reached on the 22nd of November, 2021, the price has continued to drop from the highest close on the 28th of December 2021 at $343.00. From the trendline drawn from the all-time high in 2021, the price is yet to break it to the upside. Microsoft investors have little or nothing to worry about, as the price has appreciated in the last two decades. 

    1hr Chart

    Just recently, Microsoft hired a top Apple Engineer, Mike Filippo, to work on custom chips as it looks to expand its own server-chips efforts, according to people with knowledge of the matter. Filippo’s exit is a huge loss to Apple after he has served as a top designer of semiconductors at ARM for a decade. Microsoft’s 2022 opening price was $335.24. The $MSFT bulls have failed to show up since the holidays were over. Price keeps falling as low as $304.78 on the 10th of January, 2022, making it the year’s support level. A gap-up occurred yesterday from $315.06 to $319.57.  This might lead to price recovery as our analysts look forward to the price of Microsoft reaching $341.48.

    Daily Chart

    There is no indication of price reaching a new all-time high as we look forward to receiving the earning report of Microsoft on the 25th of January 2022. On the daily chart, RSI shows the price is overbought while on the 1hr chart price is currently oversold. The hire of Filippo might boost the share price of Microsoft in the coming weeks. The trendline 01 on the chart shows that price is on a bull trend despite the bad start in 2022. RSI though shows price is overbought on the chart.

    Some of these ideas are in our clients’ portfolios. To understand which ones can work for you or for help to invest for your own wealth, talk to our advisors at FM Capital Group. Would you like more information on Investment Advisory, Portfolio Services, and VC? Schedule a meeting with us here.

  • Is the New Covid variant, IHU, a threat to WTI Oil price?

    On the 18th of November 2021, our market analysts forecasted that WTI Oil prices will rise to hit $80 per barrel after the price fell temporarily in November. This forecast was dead-on! 2021 opened at $48.29 and the year closed at $75.12 which is approximately a 56% appreciation. It is probable that the continued rise of the Oil price is linked to the low impact of the previous variant, Omicron. Since the start of the new year, the oil price has continued its bullish movement and so far from the first week of trading, it has appreciated by 6% from $75.12 which was the year’s opening price.

    Daily Chart

    As nations record increasing cases of the new Covid-19 variant, IHU, the oil market is bracing for a price dip even though OPEC signals confidence in the oil price. Some news outlets report that due to the new variant, there is uncertainty surrounding the demand for oil in the next couple of weeks. Since the ease of lockdown of 2021, the price of crude oil has maintained the support level at $61.63. According to our analysis, we forecast an oil price dip to $67.50 even though there are no indications yet. On the 4hr chart, the oil price is in the higher region of the Bollinger bands.  Despite the price of crude oil is showing that it was overbought in December, the price is yet to reverse. 

    Some of these ideas are in our clients’ portfolios. To understand which ones can work for you or for help to invest for your own wealth, talk to our advisors at FM Capital Group. Would you like more information on Investment Advisory, Portfolio Services, and VC? Schedule a meeting with us here.

  • S&P 500 And Dow Jones Reach A New All-Time High

     In our November article on S&P 500, the price had a correction as our analysts forecasted that $SPX could reach a new all-time high at $4800. The $4800 forecasted price was surpassed as the most recent all-time high is at $4824.53.  Many stocks in the SPX appreciated around this time. SPX has been able to make 1X since the pandemic lowest price at $2210. The current price of SPX is $4793.53 after the price closed yesterday lower than the all-time high at $4824.53. 

    SPX Weekly Chart


    The new variant of the coronavirus named ‘IHU’ detected in France might likely pose a threat to the index, which might lead to a price fall.  A sell-off might occur which could make the price of SPX fall to $4384.23. Despite the new all-time highs in the past months, SPX on the RSI has shown that price has been overbought multiple times since April 2021. 

    SPX 4hr Chart


    Dow Jones on the other hand made almost 1X the pandemic low at $18366. The Dow Jones recorded a new all-time high yesterday, being the second trading day of the year. There is no indication of a possible reversal. Early in December, our analysts forecasted the Dow Jones to reach a new all-time high. The new all-time was reached yesterday at $37,000.  A correction might take place.

    Dow Jones Daily Chart

    As SPX had a price fall on the second trading day of the year, Dow Jones extended its rally to a new all-time high at $37,000. The only threat to the continuous rally of the $DJI could be the new variant ”IHU’, which health officials found it has 46 mutations. These mutations are more than the omicron.  The price still maintains the upper region of the Bollinger bands. The $DJI might continue its rally for the next few days or weeks.

    Dow Jones Weekly Chart

    Some of these ideas are in our clients’ portfolios. To understand which ones can work for you or for help to invest for your own wealth, talk to our advisors at FM Capital Group. Would you like more information on Investment Advisory, Portfolio Services, and VC? Schedule a meeting with us here.

  • Apple Market Cap Hits $3Trilliion

    Apple becomes the first company in America to reach the new milestone of $3Trillion Market Cap.  The technology company has done tremendously since the pandemic. The pandemic lowest price was $53.32. The current price stands at $179.70 which is a day after the all-time high at $182.93 was reached. Therefore, investors have gained about 3x since the pandemic low.  Since Tim Cook became the CEO of Apple on the 24th of August 2011, there has been a massive rally in the share price of Apple. He has been able to achieve about 10X in the last decade. The market cap has jumped from $340billion to $3Trillion.  Apple investors have been enjoying a jolly ride due to good leadership. 

    Weekly Chart


    In December 2021, our analysts concluded that the price of $AAPL should reach a new all-time high, which might eventually take the market cap to $3Trillion as a result of continuous profit-making. Going forward, a correction might occur which leads to the market cap dropping from $3Trillion. Apple’s share price might drop about 18% in the coming weeks, which might eventually bring the share price down to $149.07, a level below the September 2021 all-time high of $157.55. Since the latter months of 2019, the price of Apple has been overbought multiple times, as the price only had a few corrections. Meanwhile, there is no indication of price reversals.  

    Daily Chart

    Some of these ideas are in our clients’ portfolios. To understand which ones can work for you or for help to invest for your own wealth, talk to our advisors at FM Capital Group. Would you like more information on Investment Advisory, Portfolio Services, and VC? Schedule a meeting with us here.

  • Evergrande Ended 2021 On The Worst Price Ever

    The Evergrande is the second-largest real estate company in China. The Chinese Evergrande did its IPO in November 2009. The share price ranged between $1.93 and $8.45 between the years 2009 and 2017 until a breakout occurred in May 2017 when the price broke the previous resistance level of $8.45. Evergrande had the best year in 2017 as the price at the beginning of the year was at $5.01 which later closed at $26.96 at the end of the year, after the price reached an all-time high at $32.50 in the same year. Since the all-time high was reached at $32.50, the chart has been showing lower highs and lower lows.

    In the early months of the global lockdown in 2020, Evergrande’s share price dropped from $21 to $10 before recovery began which later took the price to $28.01 in 2020. Since this height was reached, the bears have been more active as the price of Evergrande closed at $1.59 in 2021, which is lower than the IPO price at $4.01. Since the price showed that the price has been overbought in 2017, the price since then has fallen from the top. The chart has shown that in the last 5 months of 2021, the price has been oversold with 5 dojis.

    Since the second-largest real estate in China has been having issues with debt in 2021, there were huge selloffs. RSI is currently showing that the price is oversold and the candlesticks are in the lower region of the Bollinger bands. If Evergrande gets a bailout, the price could reach $20 in the next few months.

    Some of these ideas are in our clients’ portfolios. To understand which ones can work for you or for help to invest for your own wealth, talk to our advisors at FM Capital Group. Would you like more information on Investment Advisory, Portfolio Services, and VC? Schedule a meeting with us here.