fbpx

Buy The Right Dollar

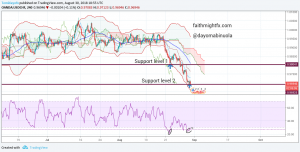
The $GBPNZD opened the new trading week challenging major support around the 1.8931 level. It even managed to crack below the staunch zone of support as the new trading week got underway. This support level has been challenged by the $GBPNZD numerous times in just the past 6 weeks. But if you look out to the daily chart, the 1.8931 level was also important support back in December 2017. As one of those old trading adages go,

“If price is knocking along a certain level long enough, eventually something gotta give”

This is an interesting time in market fundamentals. The markets are starting to pay more attention to interest rates. As political uncertainty increases, the markets seem to be reverting to the familiar: its relationship with interest rates. With one of the highest interest rates of the major currencies, the New Zealand dollar has been quietly finding buyers on every dip. Even as the Great British pound has found new strength against the Canadian and Australian dollars, it is has not enjoyed the same strength versus the New Zealand dollar.

gbpnzd 4 hour chart

Since the market opened this week, the $GBPNZD has bounced off this support zone to rally over 100 pips during the Monday trading session. Now that the $GBPNZD is back at the top of its range, kiwi buyers may step here. Watch for $GBPNZD range traders to also step in as 1.9080 has become a first level of resistance for rallies in the $GBPNZD. A break above 1.9080 opens the way to the resistance level at 1.9200.

However, as the fundamentals continue to favor the higher-yielding currencies, watch the $GBPNZD within this range. A final crack below the support zone, will introduce fresh buying momentum in the New Zealand dollar and usher in a deeper correction of the recent $GBPNZD rally (on the bigger timeframes).

Twitter GOLD?

I thank God for my follows. I follow great people on twitter. Reading through the news and got this awesome retweet from @AdamPosen:

Read the entire thread. And then let’s talk about the Canadian dollar. The loonie is swooning. It’s been weak against the Great British pound all year. But today’s market open weakness seems buttressed after the announcement of the trump’s steel and aluminum tariffs.

GBPCAD monthly chart

The $GBPCAD hit new highs today. New highs that are plowing through the 123% Fibonacci extension and a psychological level at 1.80. Today’s new highs are finally confirming the near-double bottom off last year’s (2017) low.

And to really look at the engine of this new shift in Canadian fundamentals, a girl has to look at the $USDCAD. Of course, there are new highs there too.

usdcad monthly chart

Momentum has plenty of room to build. And these are large timeframes. Of course, price won’t move in a straight line but we like the trend potential in the loonie.

There are ebbs and flows to every market. Trade what you see. Invest with a pro.

ON THE AIR with F.A.C.E.

Happy new year to the Forex Analytix team! This team of traders are experts and veterans in forex trading. Many of them I have been following for many years on Twitter (@nictrades, @spz_trader, @forexstophunter) and even before there was a Twitter (@pipczar). But the F.A.C.E. community is also full of many expert traders as well as new traders. So when I am asked to come on the show and discuss my views of the market, I consider it quite an honor. The respect, questions and great feedback I get from this team and audience makes it such pleasure to return.

Dale has such great timing as I made my first 2018 appearance on F.A.C.E. right before the Great British pound went on this monster breakout today. I revealed a few secrets that even Dale admitted he hadn’t heard from me before on his shows. The specific levels have been left far behind after Wednesday’s price action but the trading principles I discuss can be applied even now. Enjoy the show!

New Year, New Markets

Happy new year! It is 2018 and the only market that doesn’t sleep now is the cryptocurrency market. This is a brand new market being created right before our very eyes. What a time to be alive! No matter the asset or investment vehicle, human nature still reigns supreme. And in a pure market where human nature reigns (and not algos), technical analysis works so beautifully. But if you trade based on the news, you’ve been in for a wild ride. While the king of cryptos is Bitcoin ($BTC.X), 2017 saw an explosion in blockchain innovation that allowed many other coins to be created by just about anybody. This explosion in coins led to an explosion in wealth creation as buyers and sellers raced to the markets. Traders, investors and techies from the West to Zimbabwe have been making money in cryptos and everybody wants in.

Seeing the frenzy for information, I decided to host my first investment event, “What is Bitcoin, Anyway”. I rescheduled this event 3 times since September. I was originally going to talk about the importance of investing. (*yawn*) I forgot to order food. I also forgot to send out invitations. It was my first event! I was concentrating so hard on getting the talk and presentation right that the event production went right out the window. LOL oh well. Thankfully, my office is in a WeWork so the venue hid my blunders well. I had a good audience and the presentation was so well received that I was asked to do another.

What is bitcoin anyway flier

Yes, I will have another crypto event despite the crash in cryptocurrencies right now all across the board. While I understand the hesitancy in buying cryptos, I also think it is irresponsible to write off any investment opportunity due to ignorance. However, it is also irresponsible to invest, in a market this new and still unregulated, alone or naive. Do as much learning as you can. Read, watch and ask questions. Hire an investment adviser. Get a mentor. Every investment story is the same, so always do your homework — trade what you see, not what you hear.

And stay tuned for my next event, First Friday Pasadena. February is the #crypto edition?


Is It Really A Bloodbath?

Cryptos are finally making news today and not because of the a 3,000% move in a few weeks. No, every digital coin and token is down today and down BIG. It’s blood in the streets now that Jamie Dimon has repented for ever calling Bitcoin a fraud. Markets can be so ironic sometimes that it is poetic. Warren Buffet has to be grinning from ear to ear as he said it was going to end very badly anyway. He must also be buying but that’s a musing for another day.

Well, thankfully, I don’t trade off the news. You’d be in a pickle right now as to what to do with all those coins and tokens you bought yourself for Christmas. Confess now. We all bought some. The smartest of us only sold and even then, we sold too early.

ETHUSD DAILY CHART

The Fibonacci levels will tell you something different on different charts. So I’ll zero in on ethereum because ether is the only coin falling right now from all-time highs. Many of the alternative coins, the forked coins and Bitcoin itself have been consolidating lower since the 2nd week of January 2018. With the euphoric year that 2017 was for cryptocurrencies, you have to love the narrative already shaping for what 2018 will be. But looking at this chart, is it really a bloodbath yet?

What’s Your Trading Style?

A fellow trader asked:

what do u mean by style long term short term swing trade scalping ? ?

For me, trading style ultimately refers to preferred timeframes. Swing traders look at bigger timeframes, typically no less than a 4hour timeframe. A day trader will look at minute timeframes, typically no more than 60 minutes. Of course, the details vary from trader to trader.

A swing trader is comfortable holding a trade overnight and doesn’t want or need to be active in the markets every single day. A swing trader is looking to capture much larger profits on a given position. A day trader couldn’t conceive that. A scalper is very satisfied with smaller profit targets and only wants to be in a position for a few minutes/hours.

Position sizing becomes interesting when you start to look at the 2 distinct styles. Swing traders will typically scale into (and out of) a position to take advantage of the best price the market is giving. Because we are in a position for several days, swing traders take advantage of a market action that provides multiple optimal price points. Scalpers tend to trade their entire position size because they expect to exit the position relatively quickly. So in order to get their desired reward, they are willing to put on their entire position. It seems risky to a swing trader but holding a position for several days seems very risky to a day trader. It’s all about style.

A scalper and swing trader could employ the same trading strategy (Fibs, pivots, support & resistance) but their styles will have very different outcomes. Figure out and trade your style. Most traders pick one. Some traders can trade both ways. Know what works for your personality and lifestyle. Then the hard part: trade thyself.

Originally posted here on the blog on July 1, 2014

ON AIR with F.A.C.E.

Back on with Dale Pinkert and the gang at Forex Analytix Community Experience (F.A.CE.) at the beginning of autumn trading was awesome. This is the time of year that we see most likely what trends will follow us into the new year. As summer trading winds down and institutional traders return to work, many will start to use this time (September – December) to position for the new year. Keep in mind that positioning includes profit-taking and closing trades as much as it means entering trades and establishing positions for the year ahead.

In this episode, Dale and I discuss how high-yielding currencies, risk aversion, and equities are faring and what implications to keep in mind in the current market landscape. Enjoy!

As I mention in the video, I have room for new mentees! If you would like to improve your trading, I would love see if I can help you with a 1-week trial.

Intermarket Action Showing 1st Signs of Concern

The $GBPJPY has a huge wedge on the weekly chart but it has been difficult to catch a move on this currency pair. Shorts at the top of the wedge just above 147.00 level had to contend with choppy price action. After a few weeks price finally broke down lower to the 144.00 support, and former resistance, level. The reason why I don’t think we’ve seen a huge correction is because we have been moving in such a way that allows momentum measured by the RSI to reset. With the measured move lower to the 144.00 support level. When the yen caught any kind of weakness, the $GBPJPY moved as high as 146.76, close to the former highs above 147.00 which are the former lows turned now resistance level. However, I think this one will just continue to grind lower. The price action has stair-stepped all the way down allowing momentum to progress naturally lower in the midst of this very measured move to the downside. Until this week.

GBPJPY WEEKLY CHART

If you look at U.S. equities, the major American stock indices have been making new all-time highs all summer. Equities just keep grinding higher despite the divergence in momentum between price and RSI. The divergence has been recently invalidated with momentum make a new high higher than the previous high. However, the other equity markets in Europe, Great Britain and Japan have all failed to make new highs in tandem with the U.S. markets. In fact, the $DAX has already broken below recent lows and the $NIK has failed to move higher. The weak dollar has clearly supported U.S. equities higher. In converse, the strong euro has been killing European equities as of late. The forex market has certainly been a factor behind the divergence in western stock markets.

DAX WEEKLY CHART

SPX DAILY CHART

And in steps North Korea. The geopolitical tension between North Korea and the United States has been building for months. But this week, the warring ideologies escalated to fighting words. The market closed today below the summer highs for the first time since trump took office this year. This looks to be a first, early signal that the market is starting to crack. Will it be 2007 all over again a decade later? Get ready.

The Commodity Dollars Signal

The market seems to be turning higher for the commodity dollars (comm dolls), which is inline with the recent price action in commodities. Commodities, like copper, oil, and gold, have been generally rangebound in 2017 following the significant downtrends that started in 2011. During that downtrend in commodities, markets have been operating on loose monetary policy based on the flow of funds from central bank balance sheets and ultra-low interest rates. Now these fundamentals are shifting with balance sheet reductions, interest rate hikes and increasing hawkish central bank sentiment around the globe. With the fundamentals transitioning from one psychological paradigm to another one, increased volatility and choppy price action may start to creep back into the markets.

GBPCAD 4 HOUR CHART

There have been no summer doldrums in the forex markets. Starting with the Canadian dollar, the Bank of Canada (BoC) completely surprised markets last month with an interest rate hike. The start of monetary tightening in Canada now gives the CAD fundamental support for the rally that has taken place for much of this year already. So the correction this week just ahead of the Bank of England (BoE) interest rate announcement this Thursday, was a fantastic opportunity to buy Canadian dollars versus the Great British pound. The corrective rally moved right into the 61.8% Fibonacci level giving a level of risk reward that worked well for sellers ahead of the UK Super Thursday news event. The BoE was more dovish than the market expected as it cut its inflation and economic growth forecasts amongst calls for gradual rate increases. This divergence in monetary policy between Canada and Great Britain may see the $GBPCAD move to new lows.

GBPAUD 4 HOUR CHART

The Reserve Bank of Australia (RBA) released their monetary policy statement this week too. While the RBA is hawkish on the Australian economy, they remain adamant that accommodative monetary policy must remain for that growth to continue. As such, the RBA will likely not move on interest rates at all this year. But neither will the BoE. If this remains the case, the interest rate differential and the divergence in economies should continue to underpin the Australian dollar against the Great British pound.

GBPNZD 4 HOUR CHART

The $GBPNZD was trading in a wide range while we saw the aforementioned breakdowns in the $GBPCAD and $GBPAUD. The $GBPNZD finally joined suit and fell to new lows at the 1.7400 support level. But the $GBPNZD staged a major correction this week that actually saw price move back to the top of the former trading range above the 1.7900 level just before the BoE announcement. While this complete reversal higher seems like bullish price action, hindsight reveals another fantastic sell opportunity post BoE.

So now that the selling opportunities have presented themselves, can the commodity dollars continue to strengthen against the pound? There is another factor at play here that we have not yet touched upon – the weakening U.S. dollar. A weak dollar boosts most commodities since they are priced in U.S. dollars. Higher commodity prices should bolster the commodity dollars higher as well. But this is no guarantee. So take care with your trades. It’s going to be a choppy month with the occasional bursts of volatility as markets ready for full throttle trading come September. Be patient and take advantage of the setups, like these, when they come.

ON AIR with F.A.C.E

I spend every Sunday with students looking at markets for the upcoming trading week. So I was happy to share this week’s insights with Dale Pinkert this morning of the Forex Analytix Community Experience (F.A.CE.). While F.A.C.E. may be a new community, Dale certainly is not. He is an expert trader who has great experience interviewing the best personalities and experts in the business. So it is always an honor to be asked to discuss my views on markets. The nugget I dropped today that Dale really liked:

Correlations are shot. There are no correlations right now in the market.

What do I mean? Watch my interview and market review to find out.