Blog

  • RBA Remains Neutral

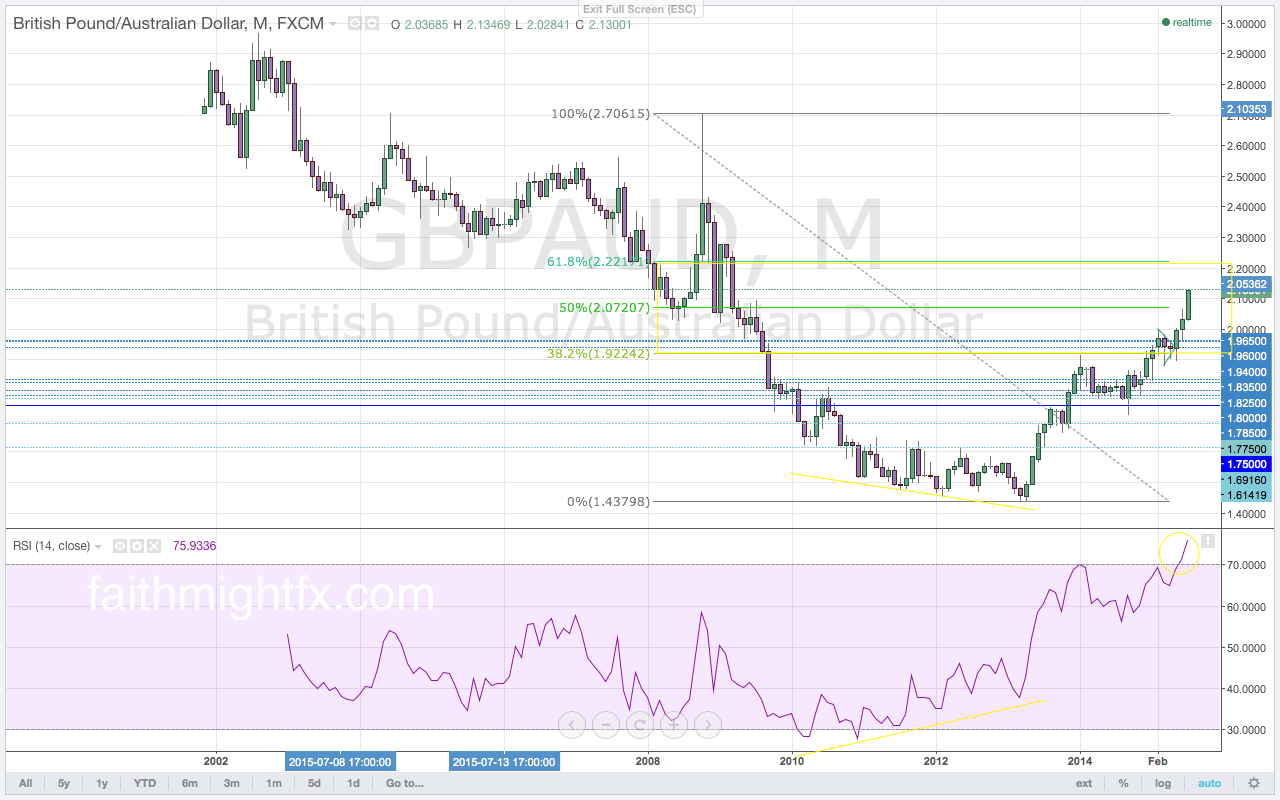
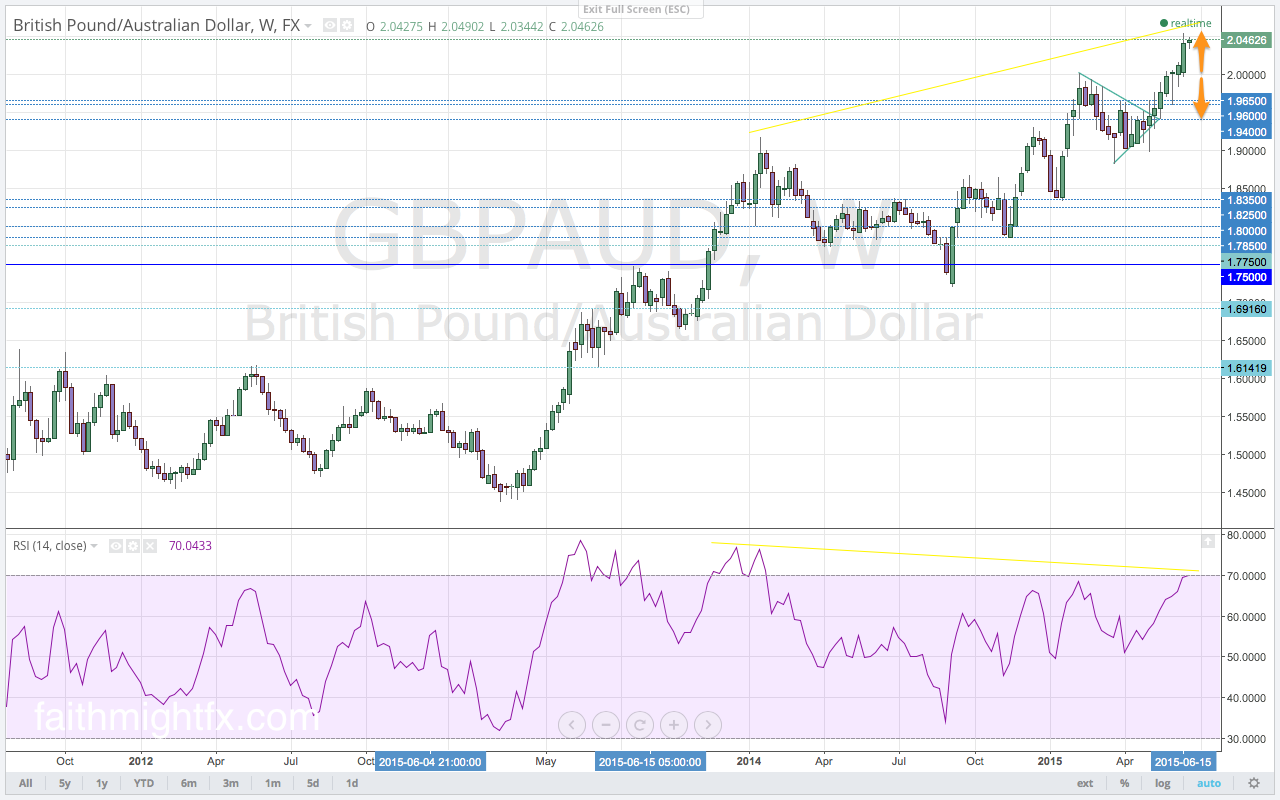
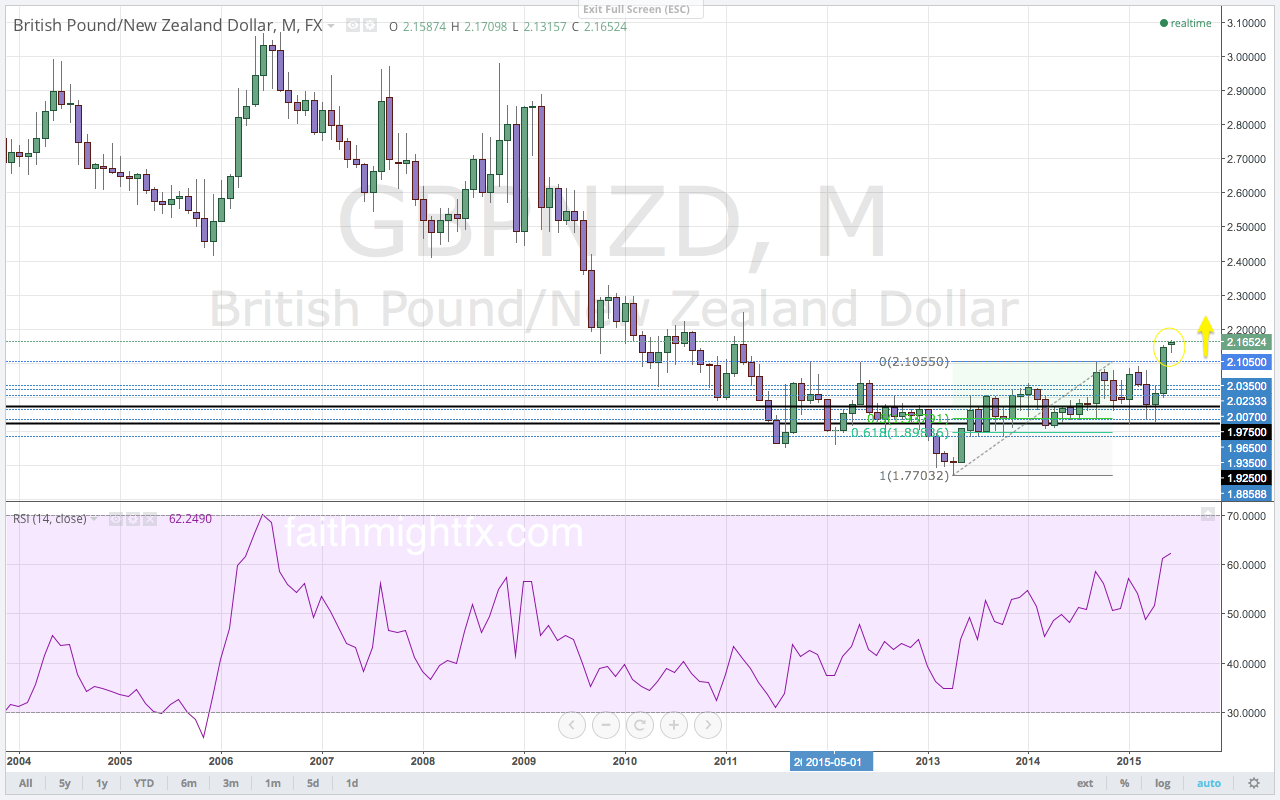
    Since consolidating in a triangle pattern back in March, the $GBPAUD has extended its break of the triangle pattern to stage a breakout rally to 2.1527. This breakout above the 2.000 resistance and major psychological level to highs took out the former highs on both the daily and weekly charts. The monthly chart must be studied for the potential of a continuation higher. Having broken above the large 50% Fibonacci level at 2.0720, this breakout rally now targets the 61.8% Fibonacci level at 2.2217. The break above the 50% Fibonacci level is a very bullish development for the $GBPAUD as it signals that price will continue to move higher. A break of the 61.8% Fibonacci signals a complete reversal. The rout in commodities has been a sore spot for the Australian dollar. Iron ore and copper, two of Australia’s largest exports, have suffered steep declines in price along with oil. Though the RBA did not move on monetary policy last month, they have stated that they were unlikely to ease monetary policy again this year despite its economy softening in the face of commodity weakness. Despite the RBA reducing calls for more easing, AUD selling has not abated. Copper, oil and gold have all opened the new trading week accelerating to new lows. If the RBA can stand firm with this more neutral sentiment in their interest rate announcement this week, the $GBPAUD may begin to turn lower.

    GBPAUD DAILY CHART

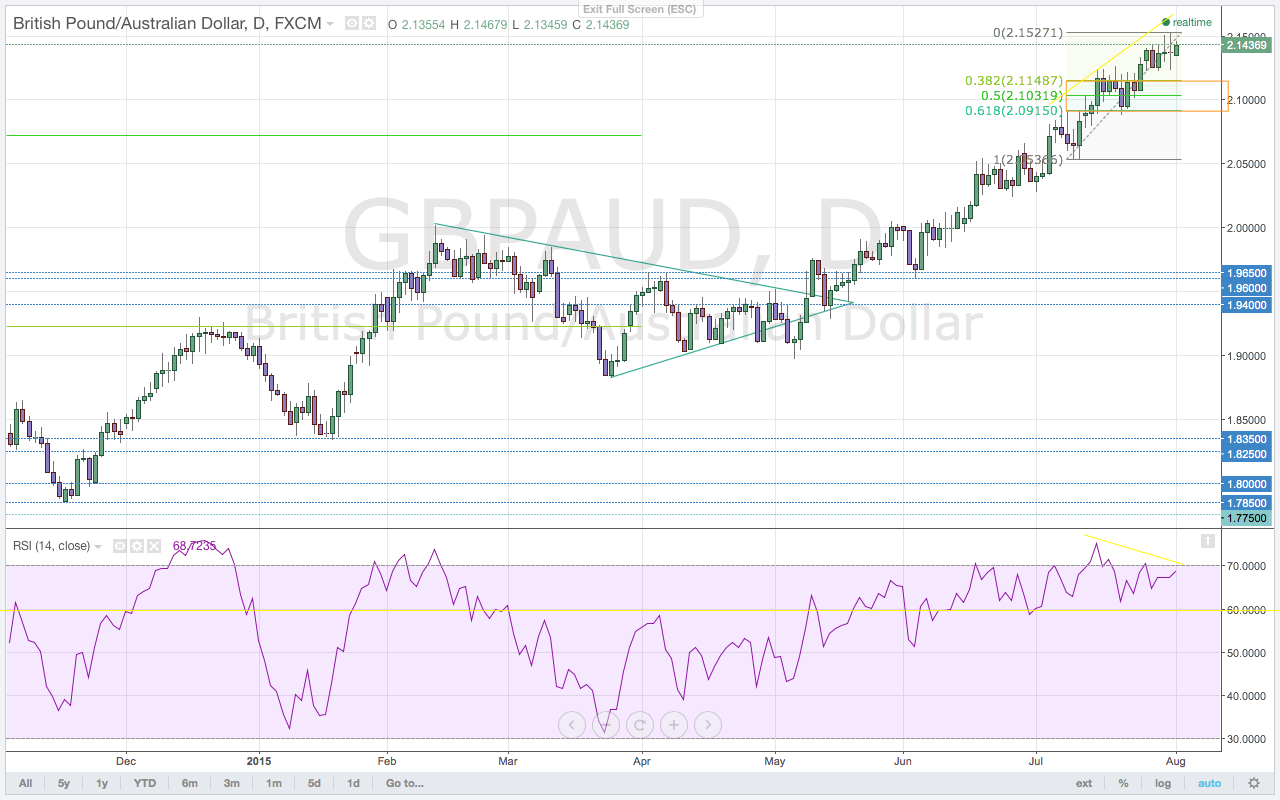
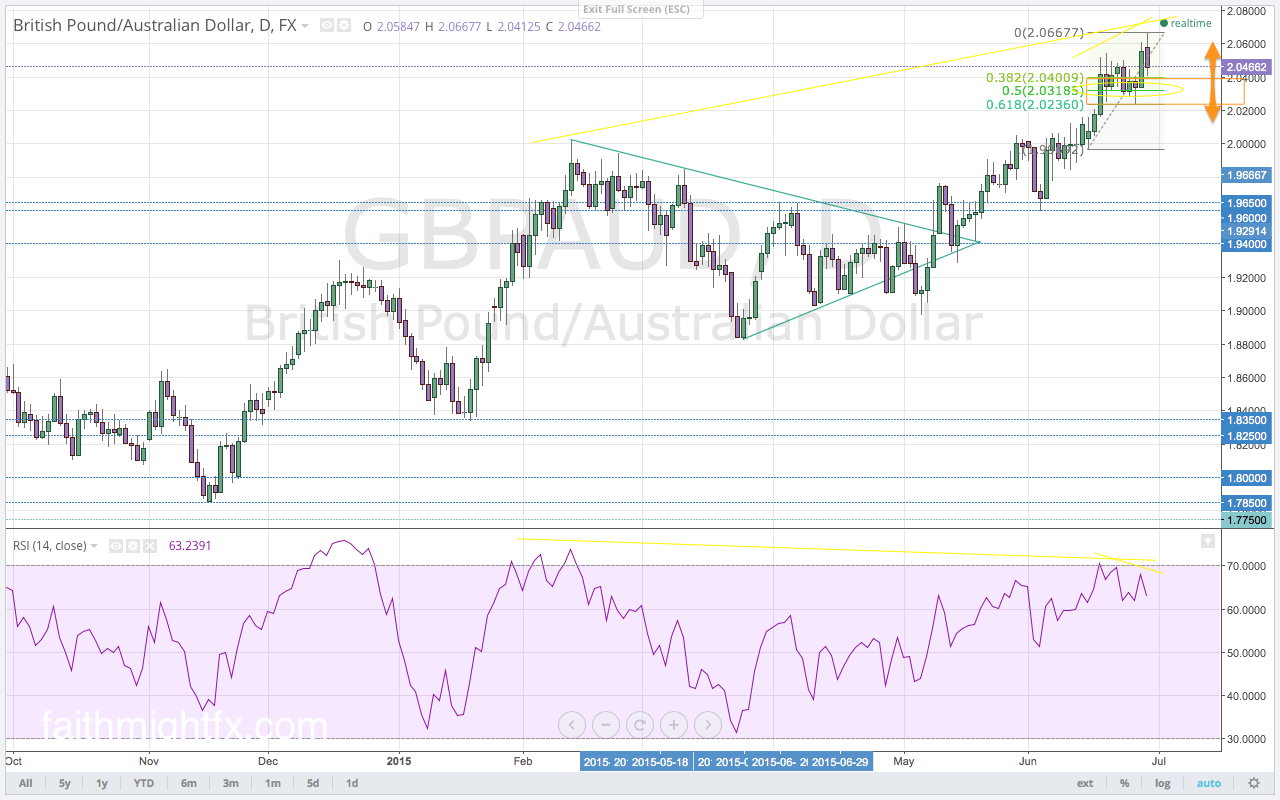
    The $GBPAUD completed its Fibonacci move from last week when it moved to new, multi-year highs at 2.1527. Despite the new, multi-year high in price, momentum is still diverging on the daily chart. This bearish divergence signals for another corrective price move lower in price. As the correction works price lower, momentum should find support at the 60.0 level. This level on the RSI has been a strong support for momentum during corrections in the $GBPAUD since breaking above the all-important 2.00, now turned, support level. With momentum currently out of overbought territory, price will have supportive buying momentum to move the $GBPAUD to new highs again. If momentum were to take out that support level on the RSI that would be a tentative signal that the $GBPAUD may be looking for a reversal. However, the bearish divergence alone is not enough to deter buyers. The $GBPAUD can still rally to new highs but if the RBA continues with more neutral sentiment after their interest rate announcement that could, in fact, trigger a selloff.


    This is an excerpt from this week’s issue of QUID REPORT. Subscribers receive my research on all major GBP pairs at the beginning of the week, including access to @faithmightfx on Twitter for daily, real-time updates to the weekly report. AVAILABLE NOW.

  • CHART OF THE WEEK: THE OZ WAGS AT RBA

    Despite the RBA reducing calls for more monetary easing, the $GBPAUD continues to march ever higher on the back of a weak Australian dollar. Quid Report readers are enjoying this pair. While it has exhibited great technical edge, its fundamental edge has developed nicely in recent months for the ultimate double whammy. Trade the currency pairs with a double whammy. This is one.


    GBPAUD MONTHLY CHART


    This chart is an excerpt from this week’s issue of Quid Report. Subscribers receive my research on all major GBP pairs at the beginning of the week, including access to @faithmightfx on Twitter for daily, real-time updates to the weekly report. AVAILABLE NOW.

  • Is Risk Aversion Here To Stay?

    The Japanese yen has found new strength on the back of risk aversion flows. It is one of the biggest beneficiaries as a safe haven currency. With the Swiss National Bank intervening to prevent safe haven flows from strengthening the Swiss franc and the U.S. dollar dealing with new interest rate expectations, the JPY has received a bulk of the risk aversion flows in the market. Evidence of this is the huge gap down the $GBPJPY experienced when the new trading week opened compared to the $GBPUSD or GBP/CHF. As the Greek debt crisis now deals with this new normal — a rejected austerity plan and debt repayment package — the $GBPJPY may continue to move lower.

    GBPJPY WEEKLY CHART

    The $GBPJPY made a new low at 189.59 [on Monday], establishing a level of support for the week. A move below the gap low targets the 38.2% Fibonacci level at 187.84. The major support and psychological level at 1.9000 is the level to watch for direction in the new trading week. The prior bullish wave already found resistance just ahead of the 1.9000 level at 189.68. Last week’s bounce higher after the gap down still has yet to fill the gap even as the bounce higher this week has already filled the gap. A continued inability of the $GBPJPY to fill its own, very large gap is a bearish signal. Coupled with the building bearish divergence between price and momentum at the recent 195.86 new highs, the $GBPJPY is poised to move into a deeper correction of the entire rally off the 175.00 major support level.

    Momentum on the daily chart waned very sharply at the highs last week. This sharp decline in buying momentum resulted in multiple false breaks of the 195.50 resistance level. Though the gap lower is due to fundamental reasons, its occurrence lines up with the technical developments over the last several trading sessions. Already lower than the previous low on the RSI, this new selling momentum has broken below the 50.0 level into bearish territory. The gap lower this week has broken below the major 190.00 support level. However, that price move lower was immediately met with bids that rallied price right back above the 190.00 level to a high of 191.64. These highs are finding resistance ahead of last week’s lows. If the $GBPJPY is unable to move higher, it is likely that price will fall back towards the 190.00 support level.


    This is an excerpt from this week’s issue of Quid Report. Subscribers receive my research on all major GBP pairs at the beginning of the week, including access to @faithmightfx on Twitter for daily, real-time updates to the weekly report. AVAILABLE NOW.

  • CHART OF THE WEEK: IT GETS EASIER

    Each week, I highlight a chart out of the Quid Report.

    After highlighting the Australian dollar last week, the $GBPAUD continues to soar to new highs. This week, the move out of the Fibonacci levels on the correction lower has moved to new, multi-year highs yet again. Momentum is trying to do something about that bearish divergence as bulls are not to be dissuaded. Between a crashing Chinese stock market, a slowing Australian economy and weak commodities, the AUD just can’t get a reprieve from the selling. It is expected to remain weak too for as long as this fundamental trifecta remains a narrative in the market.


    GBPAUD DAILY CHART


    This chart is an excerpt from this week’s issue of Quid Report. Subscribers receive my research on all major GBP pairs at the beginning of the week, including access to @faithmightfx on Twitter for daily, real-time updates to the weekly report. AVAILABLE NOW.

  • CHART OF THE WEEK: FAILURE MEANS SOMETHING

    Each week, I highlight a chart out of the Quid Report.

    The $GBPJPY failed above the 195.50 resistance level all week. Now that $GBPJPY has moved lower off these highs this week, is it now ready to break higher?


    GBPJPY 4 HOUR CHART


    This is an excerpt from this week’s issue of Quid Report. Subscribers receive my research on all major GBP pairs at the beginning of the week, including access to @faithmightfx on Twitter for daily, real-time updates to the weekly report. AVAILABLE NOW.

  • The Easy Aussie Dollar

    The release of the meeting minutes from the Reserve Bank of Australia (RBA) was met with AUD selling. The RBA maintained its dovish sentiment despite not making any changes to monetary policy at its last meeting. They, too, downgraded their economy. Even though the Australian labor market is still strong, households are laden with debt and are simply not spending money. While officials at the RBA expressed satisfaction with the effects of current monetary policy, they believe policy needs to remain accommodative. It is their assessment that the economy still requires a weak AUD trading at even lower levels. The minutes confirmed the dovish remarks from RBA Governor Stevens just the week prior. As a result, the $GBPAUD continues its rally to new, multi-year highs.

    GBPAUD WEEKLY CHART

    Momentum continues to build a bearish divergence with every new high. Last week was no exception. There still remains a bearish divergence that suggests the $GBPAUD is due for a correction. Despite the divergence in momentum, the $GBPAUD is in breakout mode. It has soared to new highs and continues to close above the important 2.00 support level. But the decreased buying momentum is glaring. The new highs at 2.0548 were accompanied by even more bullish momentum than last week’s new highs. That is a good sign for buyers this week. It suggests that fresh buyers are back in the market assured by the dovish RBA.

    The $GBPAUD has maintained an orderly rally even with the dovish RBA. Momentum followed with building bullish momentum following the rally to new highs. Last week, however, the $GBPAUD established new highs on the daily chart with less momentum than at the previous high price. With diminishing buying momentum on these new highs and a bullish close, a breakout higher could produce a false break. If price is unable to hold above the 2.0344 lows with adequate buying demand, the buy zone at the Fibonacci levels will come into play.


    This is an excerpt from this week’s issue of Quid Report. Subscribers receive my research on all major GBP pairs at the beginning of the week, including access to @faithmightfx on Twitter for daily, real-time updates to the weekly report. AVAILABLE NOW.

  • How Much More Loonie Weakness?

    The resumption in oil weakness has kept the $GBPCAD supported on the back of CAD weakness. Weakness in oil markets may also resume the dovish sentiment out of the Bank of Canada (BoC). While the BoC welcomed the weaker CAD that resulted from the slide in oil prices, the return of weak oil could also mark the return of the doves to the BoC. Recently, however, oil markets have stopped crashing and started consolidating. This stabilization may mean another push lower in oil is eventually coming. As long as the crude oil futures market are unable to rally further beyond the $60 level, the $GBPCAD will find traction to move higher.

    The $GBPCAD had been range bound between 1.8900 and 1.9100 as oil markets consolidated. Thus, it has been Canadian economic data dictating direction in the $GBPCAD in recent weeks. Despite a good housing starts number released last week, it was the poor capacity utilization number that weakened the CAD. The $GBPCAD moved back above the 1.9100 resistance level to close the week. The new trading week has already seen a weak Canadian manufacturing sales report rally the $GBPCAD to new highs at 1.9234. These new highs complete the Fibonacci move after last week’s correction. With wholesale sales, retail sales and inflation numbers to be released this week, any weak data will see the $GBPCAD continue its rally back toward the highs at 1.9555. However, strong data will cause the $GBPCAD to retrace the current rally.

    GBPCAD 4 HOUR CHART

    With the close of last trading week above the 1.9100 level, the $GBPCAD had its first bullish close above the range between 1.9100 and 1.8900. Manufacturing data is such a market mover for the CAD because of Canada’s export-dependent economy. In fact, last week BoC Governor Poloz warned of weak economic effects due to bad weather extending into the second quarter of economic activity. The weak data seems to confirm this BoC warning issued just last week. Therefore the CAD will be on the back foot in trading this week. This CAD weakness will only be amplified on any weakness in the crude oil markets.


    This is an excerpt from this week’s issue of Quid Report. Subscribers receive my research on all major GBP pairs at the beginning of the week, including access to @faithmightfx on Twitter for daily, real-time updates to the weekly report. AVAILABLE NOW.

  • CHART OF THE WEEK: HOME IN THE RANGE

    Each week, I highlight a chart out of the Quid Report.

    The euro behaved as expected in this week’s Volume 15. The levels on the daily chart foretold the dramatic story of Greece. The week started off with a deal taking shape that rallied the $EURGBP off the 0.7250 level.  Then Greece played hard ball and the IMF left. Germany said the euro was too strong. $EURGBP peaked and fell to 0.7200. $EURGBP rallied off that support to close the week in that quirky little zone between the arrows. How will euro trade next week?


    EURGBP DAILY CHART


    This is an excerpt from this week’s issue of Quid Report. Subscribers receive my research on all major GBP pairs at the beginning of the week, including access to @faithmightfx on Twitter for daily, real-time calls and adjustments to the weekly report. AVAILABLE NOW.

  • RBNZ Ushers in More Kiwi Weakness

    The $GBPNZD continued its move higher last week by extending the rally to new highs at 2.1709. Since the breakout rally took out the former highs on both the daily and weekly charts, we must look to the monthly chart for the potential of a continuation higher. Looking at the monthly chart, the importance of the 2.1050 level is significant for future direction. After finding resistance at the 2.2050 level back in, the $GBPNZD made many attempts to move lower. Soon the $GBPNZD was trading in a huge range between 2.1050 and 1.9250. The past two months found price holding the bottom of that range to breakout above the range top. With a confirmed close above the key 2.1050 level, the $GBPNZD has potential to move higher still. The next major level of resistance is found just above the major 2.2000 psychological level.

    GBPNZD MONTHLY CHART

    While the breakout of last week took price to new highs, momentum, on the other hand, did not follow suit. The RSI shows a bearish divergence on the daily chart at the highs. This divergence has the potential to push price lower into the buy zone marked by the Fibonacci levels of the latest bullish wave. Though the 2.1050 level is a key level for direction, it is the 2.0800 level that must hold as support for the $GBPNZD to maintain its bullish bias.


    This is an excerpt from this week’s issue of Quid Report. Subscribers receive my research on all major GBP pairs at the beginning of the week, including access to @faithmightfx on Twitter for daily, real-time updates to the weekly report. AVAILABLE NOW.

  • CHART OF THE WEEK: USD BULLS RETURN

    Each week, I highlight a chart out of the Quid Report.

    While the timing still may be unknown, the Federal Reserve remains on track to raise interest rates this year. This makes the $FED the most hawkish central bank in the world. Despite the recent bout of weakness, the USD should rise due to the contrast in monetary policy between the Federal Reserve and the rest of the world. The reason that USD weakness may persist is that the U.S. economy is not strong enough to justify aggressive monetary tightening. While the $FED may be considering a schedule of interest rate hikes, it cannot commit to it with the U.S. economy still so fragile. So even if the $FED surprises markets with an interest rate hike in June, it is unlikely it will spark a change in trend. While there will be a knee jerk reaction when the $FED raises interest rates, the USD could continue to weaken if markets price in a delay in subsequent interest rate hikes for as long as the U.S. economy remains soft.


    GBPUSD WEEKLY CHART


    This is an excerpt from this week’s issue of Quid Report. Subscribers receive my research on all major GBP pairs at the beginning of the week, including access to @faithmightfx on Twitter for daily, real-time calls and adjustments to the weekly report. AVAILABLE NOW.