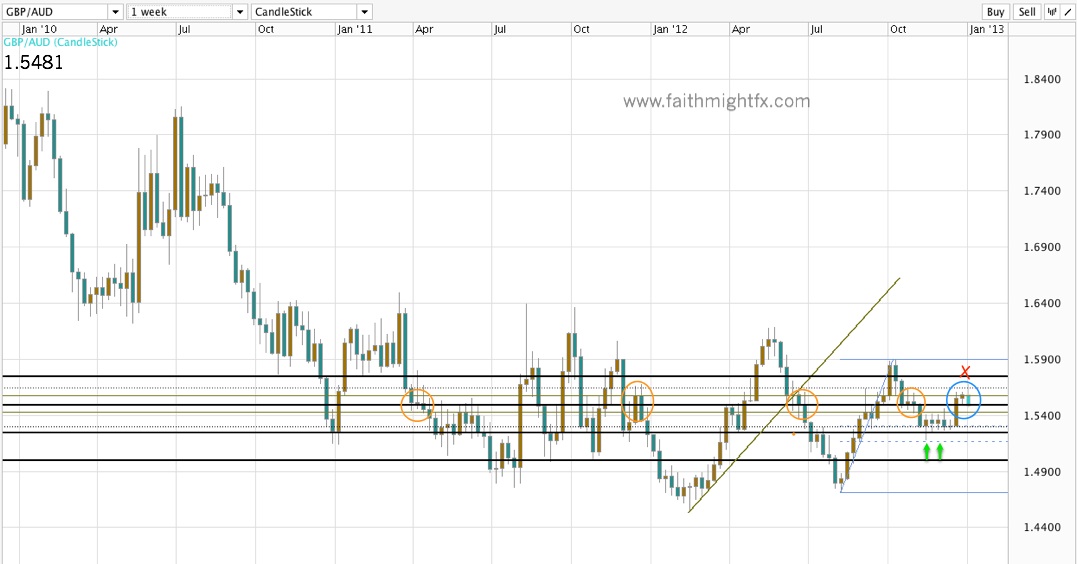
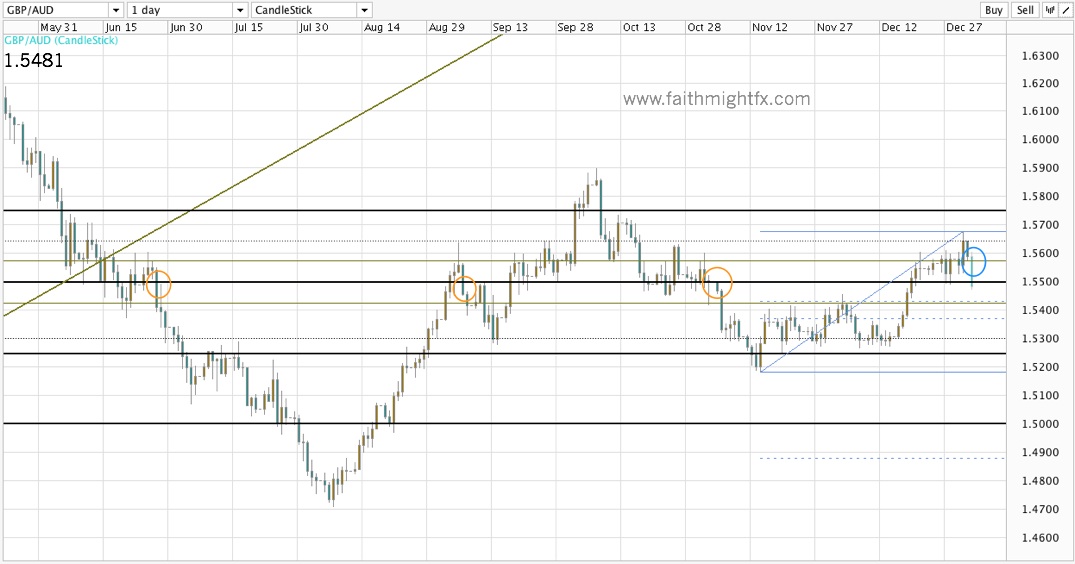
Looking to the left of the chart, we can see that previous breaks lower that closed the week below 1.55 saw momentum carry price lower. Even on a smaller time frame, the daily chart, a candle close below 1.55 followed by a subsequent candle close below 1.55 saw a price drop as low as 1.5250.
This was how I closed my new year post on the $GBPAUD. In today’s Wednesday session, the pair actually broke that support at 1.5250 to reach a low of 1.5191 before bouncing back to the 1.5250 to end trading just below the former support level.
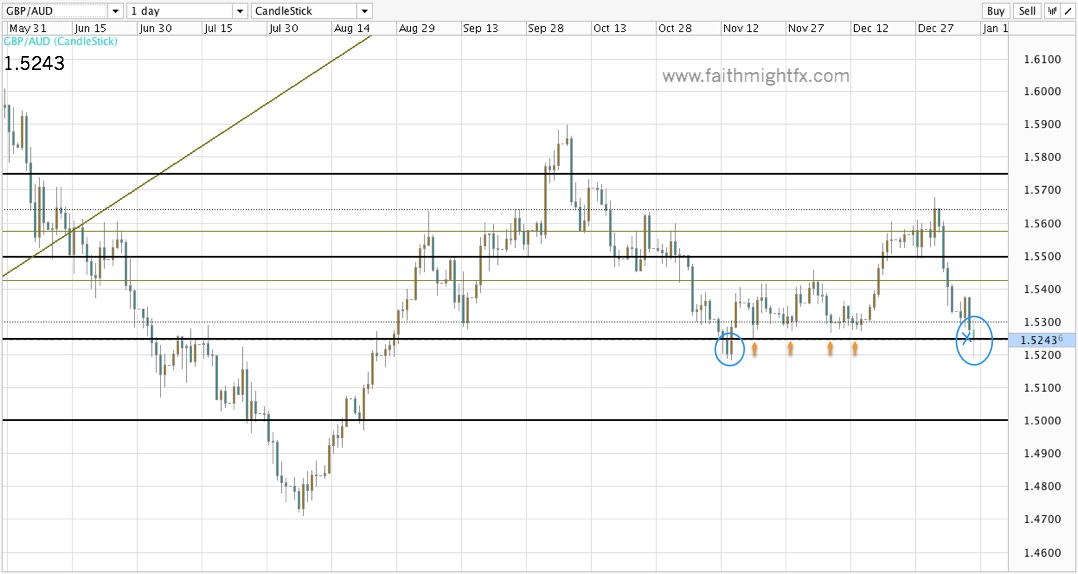
Now China has just released its trade balance numbers (9:00pm EST) and they beat market expectations by a wide margin. As such, the AUD is rallying big time in reaction to the positive news. Already down 70 pips in 20 minutes, the $GBPAUD has made new lows than the previous 1.5190 lows and is still falling. With no real support until the 1.50 major psychological level, $GBPAUD is on track to test its 2012 lows at 1.4700.