As of February 2024, Amazon has a market cap of $1.751 Trillion. This makes Amazon the world’s 6th most valuable company by market cap. The market capitalization, commonly called market cap, is the total market value of a publicly traded company’s outstanding shares and is commonly used to measure how much a company is worth. This year, $AMZN crossed the borderline of $1.7 Trillion market cap for the first time.
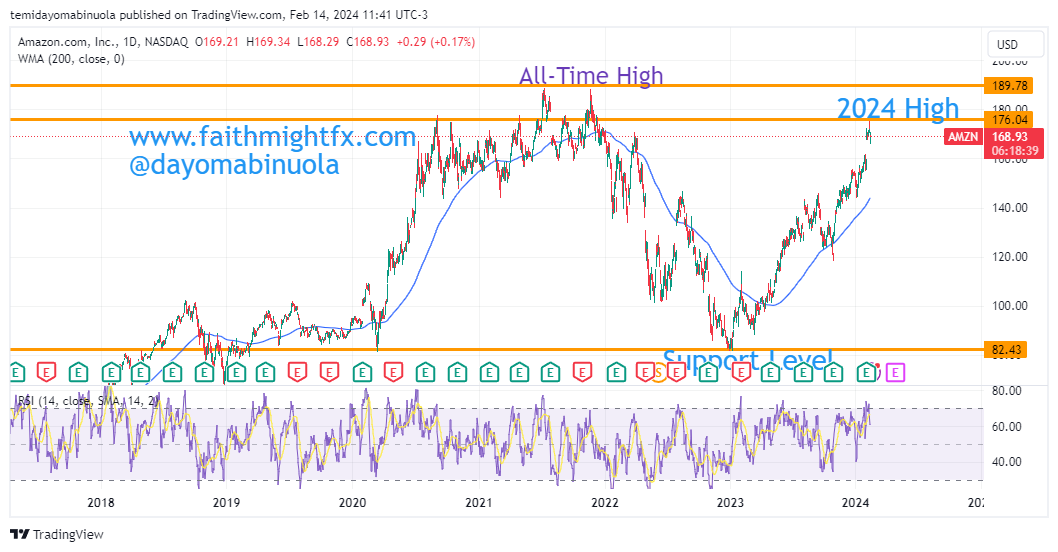
The current price of $AMZN as of the time of this publication is at $168.64. Recently, Jeff Bezos sold roughly $2 billion worth of his Amazon stock according to financial filings. Despite this latest divestment, Bezos retains a significant stake in Amazon, holding approximately 964.2 million shares and representing 9.3% of the company’s outstanding shares. While stepping down as Amazon CEO in July 2021 and handing the reins to Andy Jassy, Bezos remained chairman. He has steadily transitioned his focus towards his space venture, Blue Origin, while gradually reducing his active role in Amazon’s management.
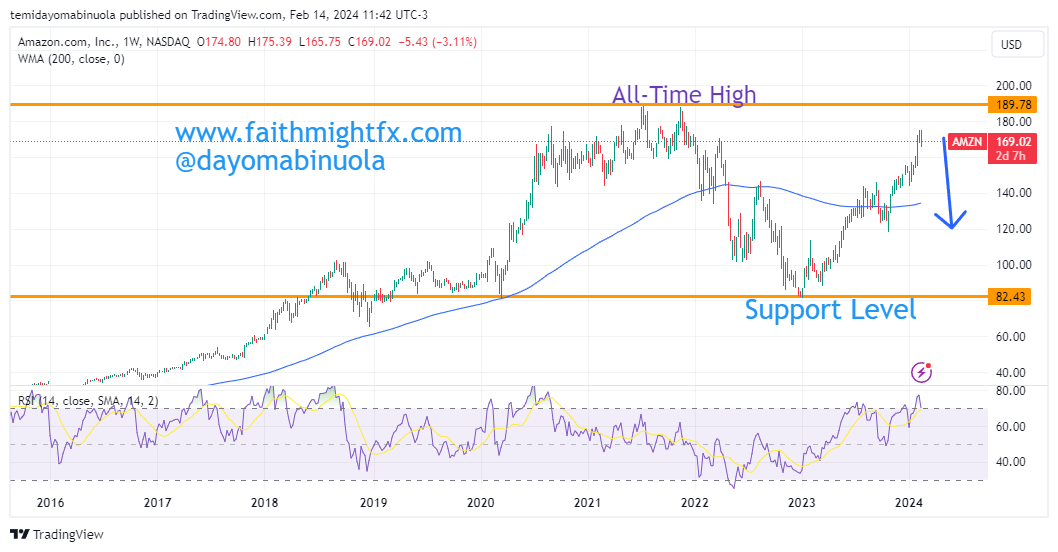
In the coming weeks, the price of $AMZN could fall to $120 as a result of Jeff’s huge sales of the shares.
Some of these ideas are in our clients’ portfolios. To understand if this one can work for you or for help to invest your own wealth, talk to our advisors at FM Capital Group. Would you like more information on how to get stock in your portfolio? Schedule a meeting with us here