fbpx

UNCHARTED Podcast: Episode 4

CRYPTOCURRENCY: An overview of the Crypto market
CRYPTOCURRENCY: Analysis of Bitcoin & Ethereum

In this podcast episode, we did a general review of markets. First, we extensively discussed Cryptocurrencies. We looked into Bitcoin and Ethereum and the recent stagnation. We also did a forecast of the direction that these major Cryptos may move in the coming months. We touched on Solana and the impact Bitcoin has on all cryptocurrencies. Here’s a forecast on Bitcoin we made some months back.

CURRENCIES: The Impressive Run of the US Dollar and how Risk-Aversion is contributing to it
CURRENCIES: Depreciation of world currencies and their reliance on the USD
CURRENCIES: US Dollar as a Safe Haven, GBPUSD, & NZDUSD
CURRENCIES: Possible causes for USD rise and Inflation
CURRENCIES: US Economic Strength and quarter-over-quarter GDP growth
CURRENCIES: Recession Fears & USDJPY

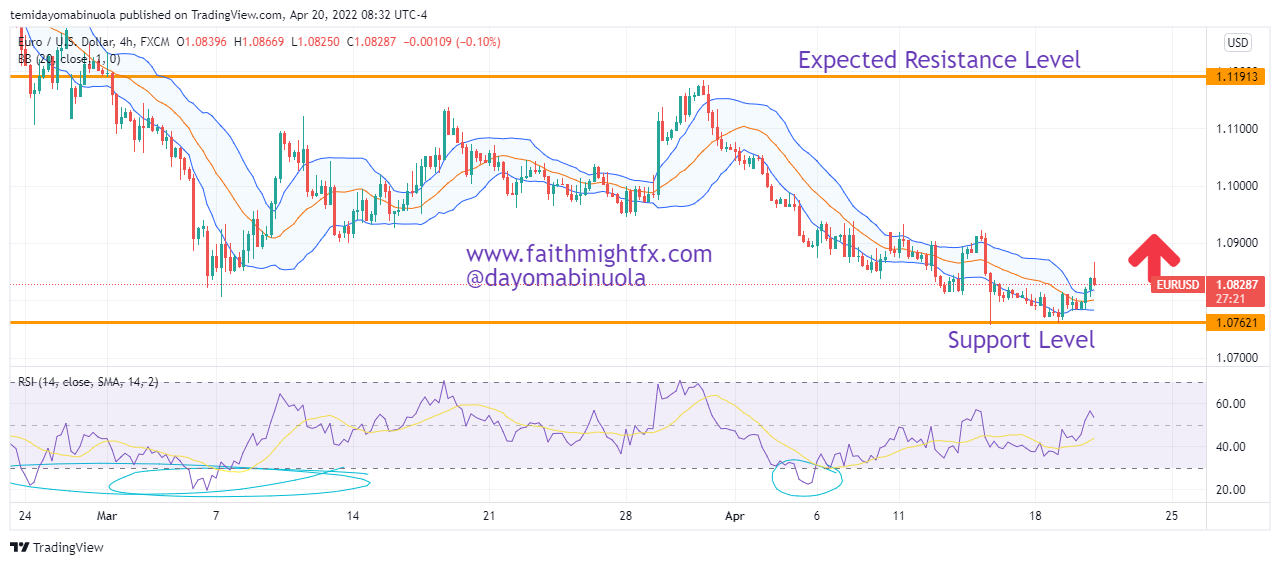
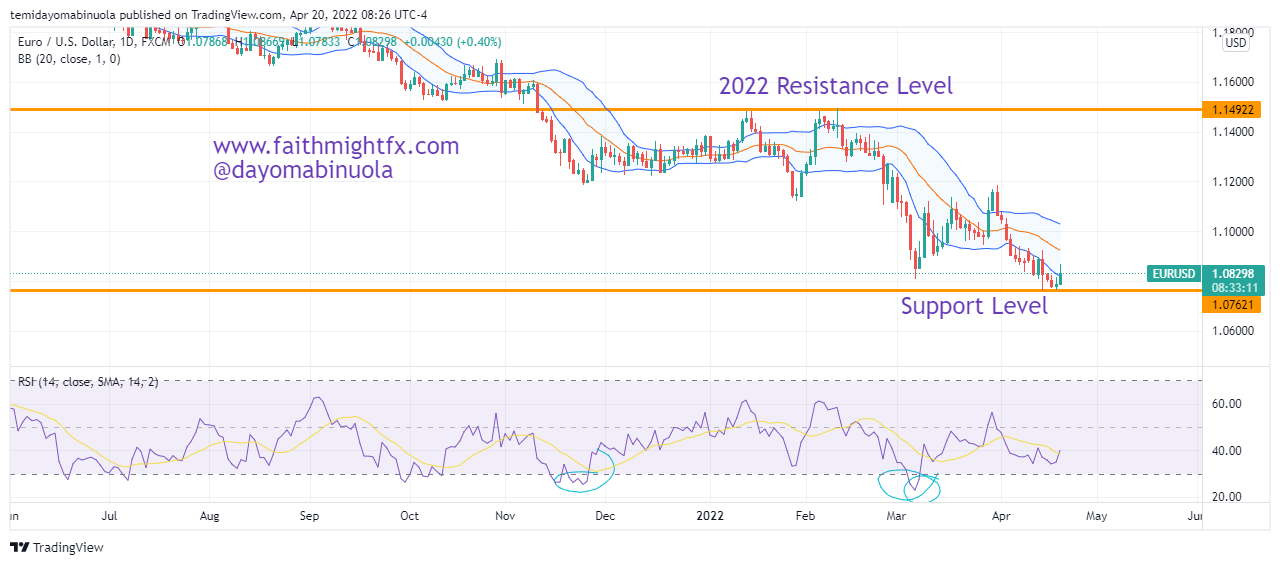
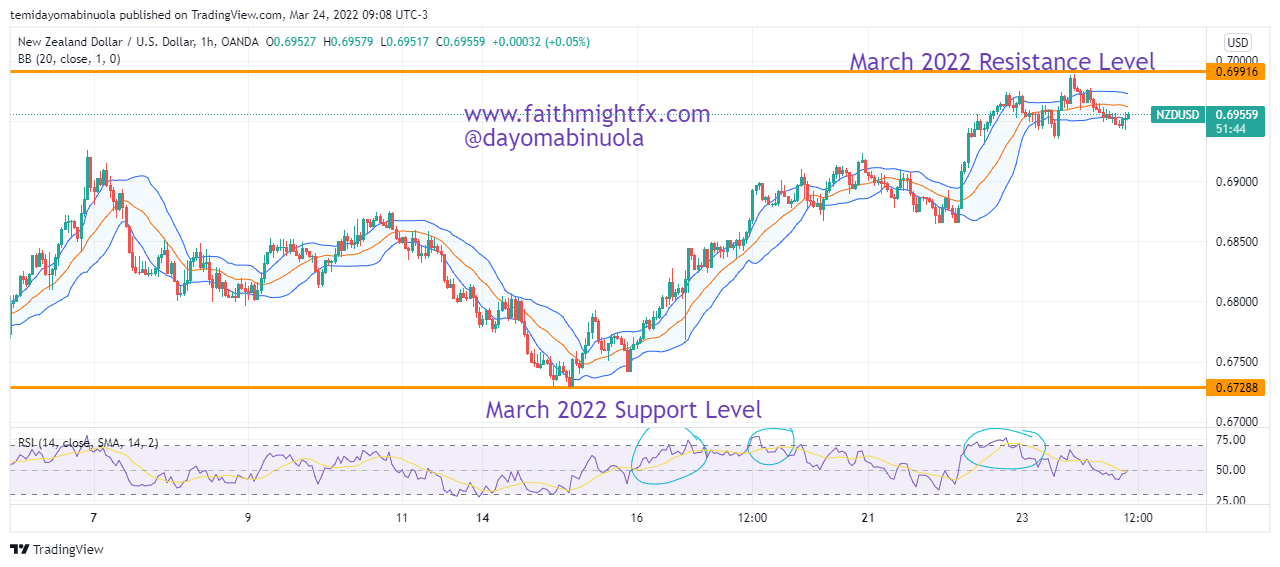
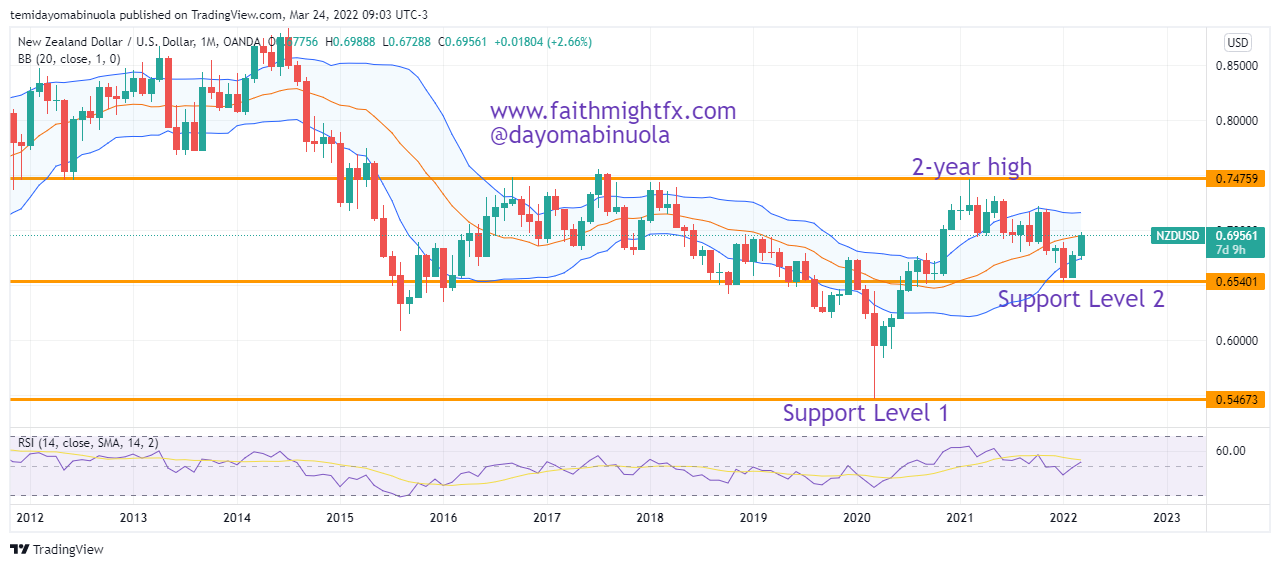
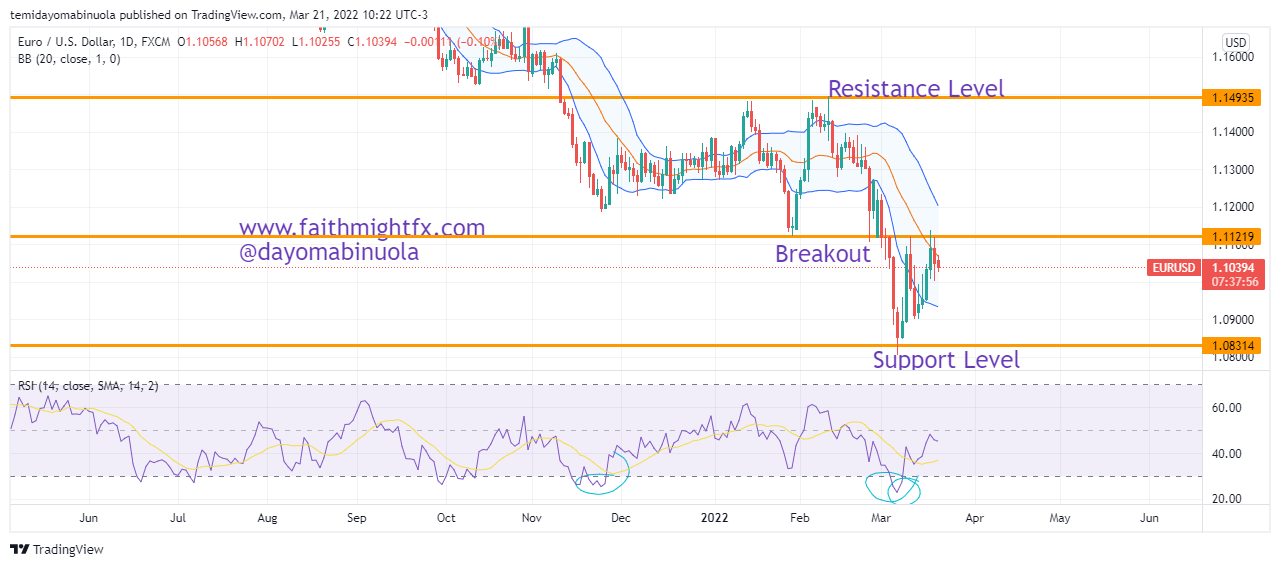
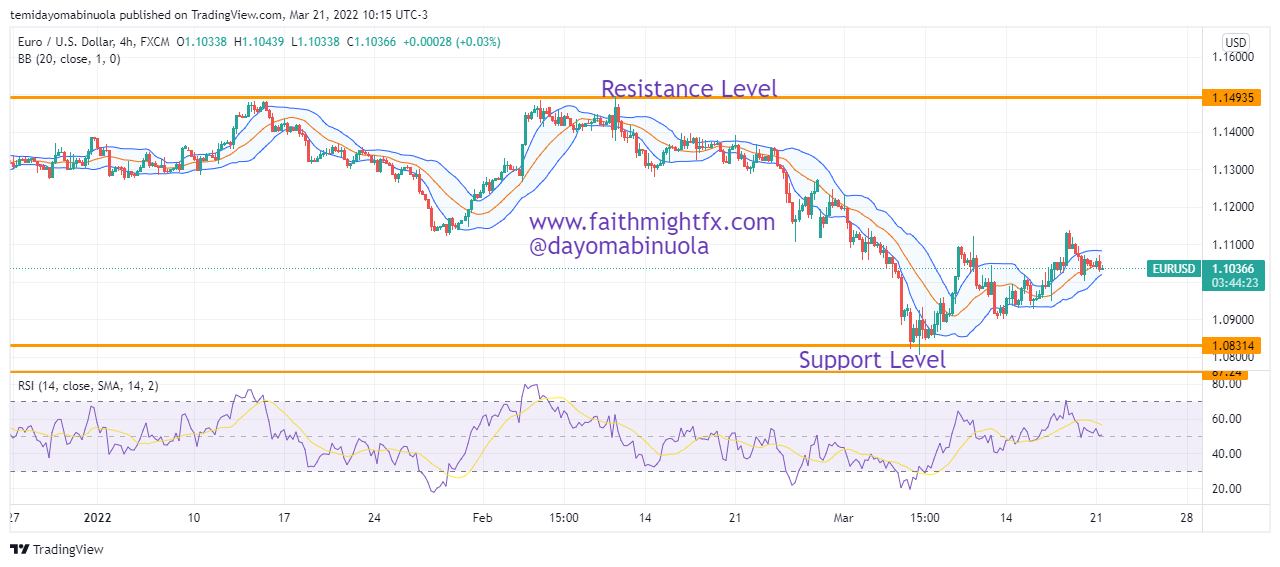
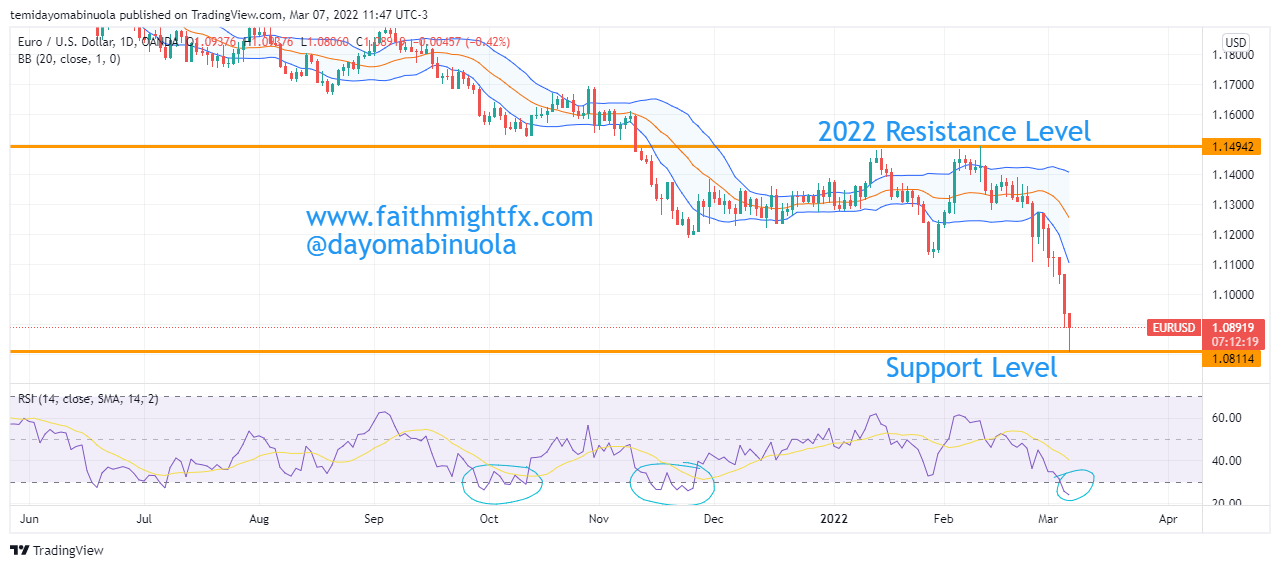
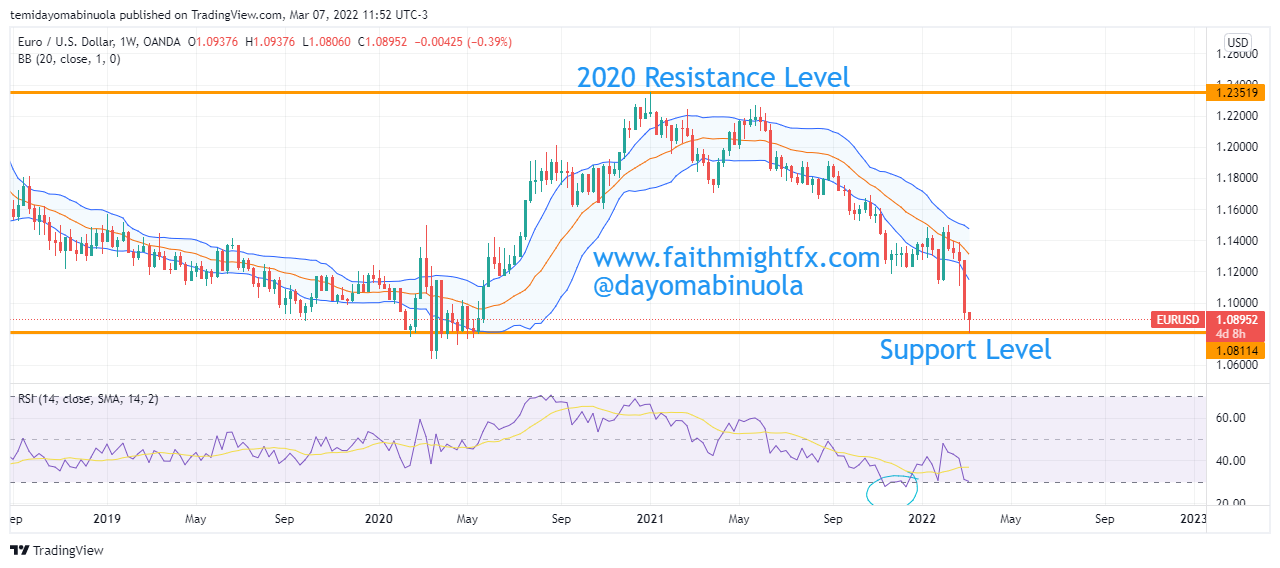
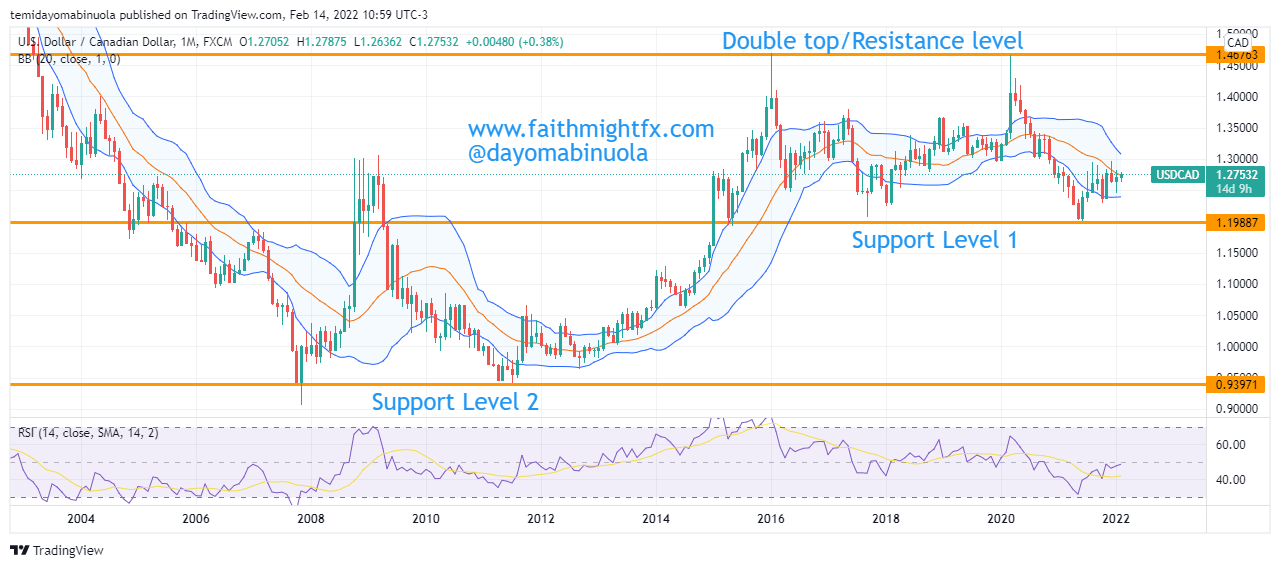
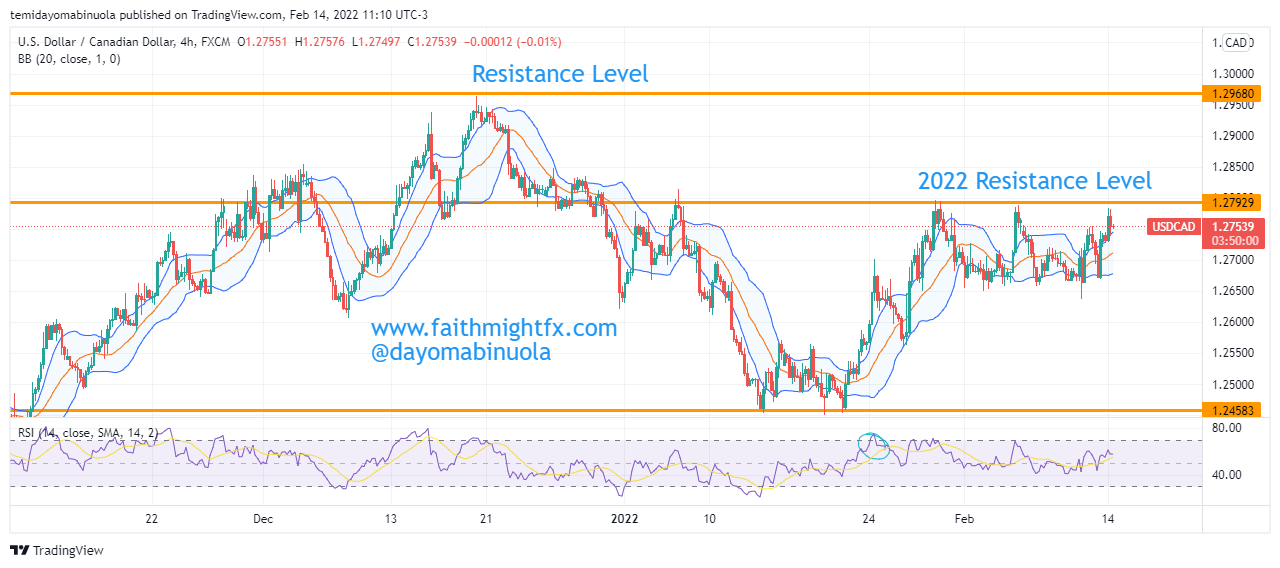
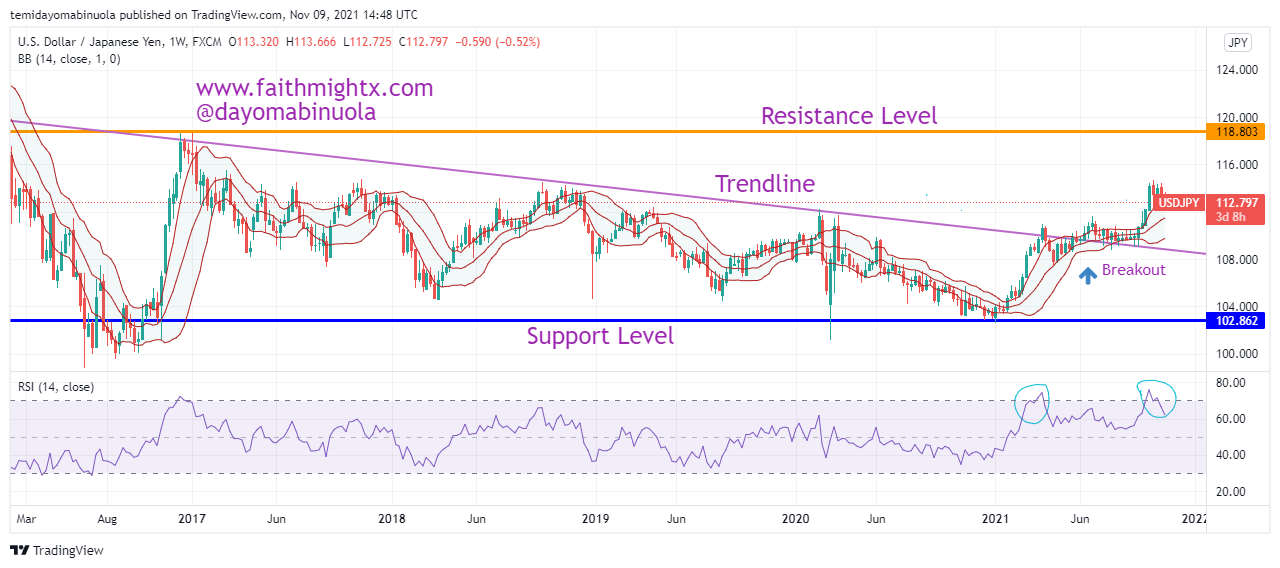
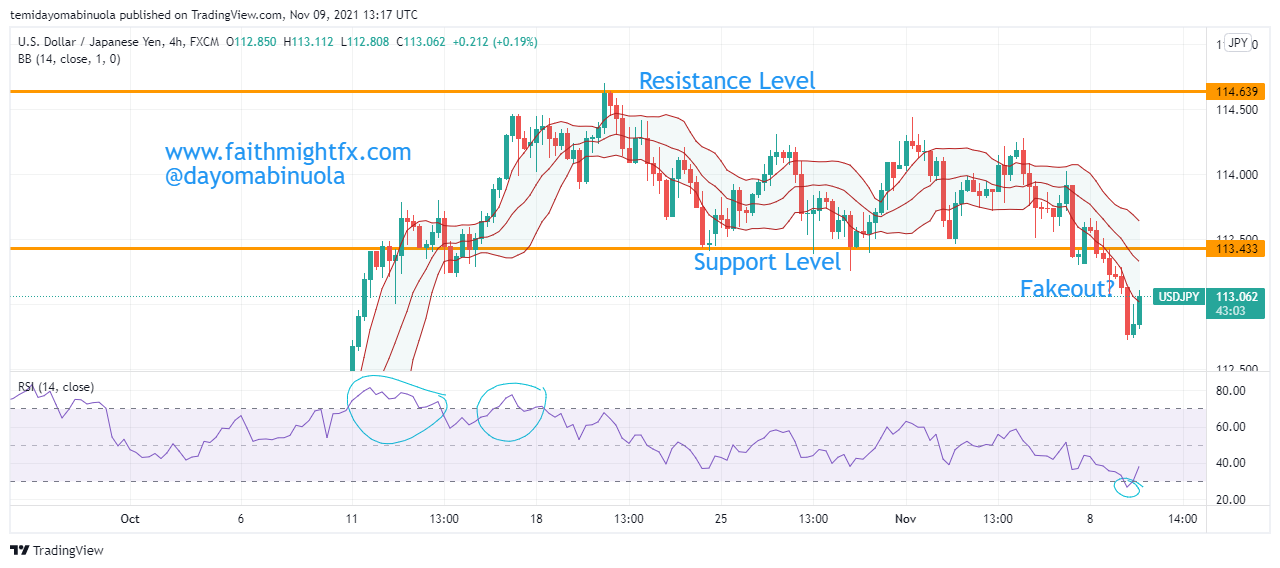
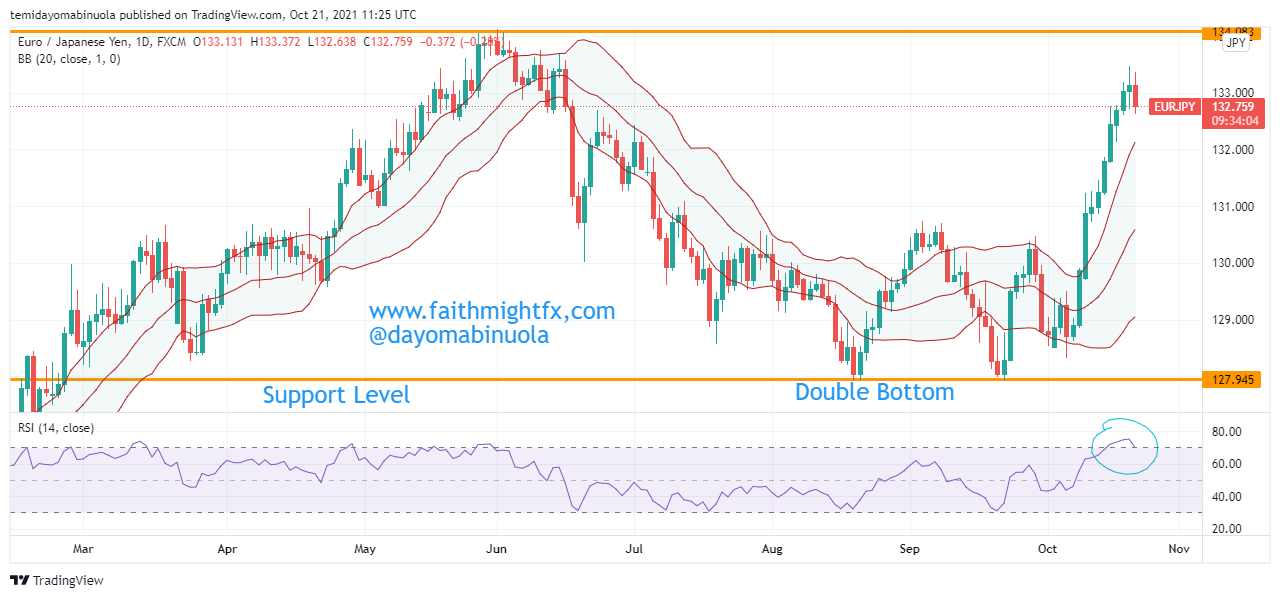
We also took a dive into the world of Currencies, specifically the United States Dollar. The Dollar has been dominating the world of currencies. Despite inflation rates being sky high, the Dollar seems to be doing relatively well when compared with other major currencies. We also discussed the Central Banks and their reactions to the inflation their respective countries face.

COMMODITIES: An overview of Gold & Silver
COMMODITIES: USD vs Gold, which is the Safe Haven of Choice?

We closed this episode on Commodities. During times of crisis, it is expected that people will hedge their funds in Precious Metals but this isn’t what we are seeing. Investors are hedging their funds in USD and investors from emerging markets also see USD as a safe haven as opposed to Gold and Silver.

Some of these ideas are in our clients’ portfolios. To understand if this one can work for you or for help to invest your own wealth, talk to our advisors at FM Capital Group. Would you like more information on how to get stocks in your portfolio? Schedule a meeting with us here.

The USD Continues Gaining Against The EUR

EURUSD opened in the year 2022 at 1.13695. All through 2021, EURUSD was majorly bearish with 8 out of 12 of the monthly candlesticks being bearish. The pair continued its bearish run as it entered 2022 and found support at 1.07574. 

4hr Time Frame

Despite the continuous fall, there have been a few times when the bulls tried to trigger a rally. However, each time this happens, the bears overpower the bulls and send the price further downwards. On the 4-Hour timeframe, the price has indicated oversold positions since the first week of April. Despite this indication, the bears are still dipping the price of EURUSD. 

Daily Chart

There are indications that the price could rally, against the current odds, to 1.11542 as the price recovers in the coming weeks. Currently, the price has crossed over to the upper region of the Bollinger Bands which could be an indication of the next bullish run.

Some of these ideas are in our clients’ portfolios. To understand if this one can work for you or for help to invest your own wealth, talk to our advisors at FM Capital Group. Would you like more information on how to get currencies in your portfolio? Schedule a meeting with us here.

NZDUSD Finds New Support Level

As a result of the global pandemic in 2020, the NZDUSD went as low as 0.54724. Since then, the New Zealand Dollar has been able to appreciate against the United States Dollar in the past two years. Between these two years, the price hit a high of 0.74670, and this happened in February 2021. Last year, the bears were more active on NZDUSD and the bearish trend from last year found a new Support Line at 0.65340 which is about 1000 pips from the high in Feb 2021.

1hr Chart

Despite the bearish turn in January 2022, the months of February & March 2022 have both been bullish. The NZDUSD pair is currently at 0.69511. This rally might not be maintained as RSI has shown multiple times that price has been overbought on the 1-Hour timeframe. Also, the price is currently consolidating on the 4-Hour timeframe. This consolidation might lead to a bearish turn that could drive the price down to 0.67374.

Monthly Chart

Some of these ideas are in our clients’ portfolios. To understand if this one can work for you or for help to invest your own wealth, talk to our advisors at FM Capital Group. Would you like more information on how to get currencies in your portfolio? Schedule a meeting with us here.

USD TO GAIN MOMENTUM AGAINST THE EURO

EURUSD opened in 2022 at 1.13685. The bulls attempted a rally but the upward movement wasn’t a strong one and in the process, a double top was formed. This double top happened between January 2022 and February 2022 and during this period, the price hit the year’s high at 1.14965. After the double top, $EURUSD dipped to 1.08062, about 700pips loss from the year’s high.

Daily Chart

This month, EURUSD rebounded and made its way to January’s support at 1.11218. This upward movement has continued and the price has reached a monthly high of 1.11395 as of 17/03/2022. As suspected, this rebound is not evolving into a full-blown bullish rally as $EURUSD has begun to lose its bullish momentum. The price is currently falling even though there are no indications on the RSI that the price has been overbought on the 4-hour timeframe. If the price closes in the lower region of the Bollinger Bands, this might lead to a continued bearish run.

4hr Chart

As the price continues its downward trend, technical indications show that the bears might be more active as the price might reach 1.08236 which may serve as the major support level for the first half of the year 2022.

Some of these ideas are in our clients’ portfolios. To understand if this one can work for you or for help to invest your own wealth, talk to our advisors at FM Capital Group. Would you like more information on how to get currencies in your portfolio? Schedule a meeting with us here.

EURUSD Experiences Worst Fall Since Mid-2020

The EURUSD pair opened for the year 2022 at 1.13832. The price rallied for some time until it surpassed the year’s opening price. In the same month of January, the rally halted and the price took a bearish run below the year’s opening price. On the last day of January, the price was 1.12376.

In the first few days in February 2022, EURUSD rallied to the year’s resistance at 1.14949. However, since February 10, 2022, price has been falling reaching a new low on Monday, 7 March 2022, at 1.08112. This new low was last reached on the 18th of May 2020. Looking at EURUSD on the monthly chart, between mid last year and now, the pair has lost about 140 pips.

Indications from RSI showed oversold positions in November 2021 and December 2021. On the weekly chart between Week 3 and Week 4 in February 2022, there was a gap down. Price closed in Week 3 at 1.12711 and opened in Week 4 at 1.11178.

In the coming weeks, the gap down might be filled as EUR gains against the USD and the price could go above 1.12062. Price is currently at the lower region of the Bollinger Bands but we should watch out for the bulls.

Some of these ideas are in our clients’ portfolios. To understand if this one can work for you or for help to invest your own wealth, talk to our advisors at FM Capital Group. Would you like more information on how to get stocks and currencies in your portfolio? Schedule a meeting with us here.

The Loonie Might Appreciate Against The Buck

At the beginning of the global lockdown in 2020, the bucks gained massively against the Canadian dollar as prices moved from the ranging market between 1.29582 and 1.33864. This price range was before the lockdown, which lasted for more than 6 months. A breakout of the range occurred in February when the price rallied to 01.46710. That rally was about 150pips. The price of $USDCAD was last reached 1.46710 in January 2016 until the rally before the lockdown. After the lockdown easing, the loonie gained against the dollar which made the price reach 1.20193 in June 2021 after 6 years. 

Monthly Chart


As the $USDCAD maintains support at 1.20103 since last year, a bounce has occurred as the price reached 1.29658 from the support level. Though RSI shows price has been oversold, the bears could still push lower to 1.24754 from its current 1.27472. RSI  shows the price has been oversold on the 4hr Chart. Looking at the monthly time frame, the price has been ranging for about 6 months with the bulls more active. The bears might take charge in the next trading days. 

4hr Chart

Some of these ideas are in our clients’ portfolios. To understand if this one can work for you or for help to invest your own wealth, talk to our advisors at FM Capital Group. Would you like more information on how to get currencies and stocks in your portfolio? Schedule a meeting with us here.

EURCHF Is Set For A Rally

The EURCHF pair has maintained a support level at 1.05148 for over 5 years. Since the beginning of the pandemic in the year 2020, EUR has gained more than the CHF, as the price moved from the support level at 1.05148 in May 2020 to a new resistance level of 1.11540 in March 2021. From March of this year, the Swiss Franc appreciated against the Euro as price reached 1.05291, a few pips away from the support Level from the resistance level of 1.11540. The weekly chart shows a double bottom which might lead to the next rally, as $EURCHF appreciates.

On the other hand, the 1hr chart shows the price of $EURCHF has been ranging between 1.06741 and the support level of 1.05148 since the beginning of November 2021. A breakout of the range might occur if EUR appreciates against the CHF. RSI shows that the price has been overbought but no trace of the price being oversold before the next rally. A breakout of this month’s resistance level might push the price to the next major resistance level at 1.07034.

USDJPY Broke Support Level After Weeks In Range

In October 2021, the $USDJPY pair closed above 113.830 since November 2018. Price closed at the highest level in the last 3 years at 114.358 on the 19th of October. $USDJPY has maintained its price around 102.862 since 2016. On the weekly chart, there are above 5 times in the last 5 years that price tried to touch and break the support, but it eventually led to a bounce. The most recent bounce occurred between December 2020 and January 2021. It has all been bullish for the $USDJPY in 2021. The trendline has been drawn from 2016 to 2021, which shows there is a breakout to the upside. This breakout of the trendline occurred in June 2021. RSI on the chart still shows that the price has been overbought in two different cases. Will this lead to price reversal?

The 4hr Chart has shown that price maintained a support level at 113.253 since a breakout to the upside occurred in the first two weeks of October 2021. Price has been raging between 113.253 and 114.655. The support level was broken to the downside this month. The breakout might be a fakeout, as the price is beginning to consolidate as USD has been gaining against JPY in the past few days. The price might appreciate to 113.690 in the coming weeks from its current 112.904

EURJPY Price Failed To Touch The Previous Resistance Level

$EURJPY’s price at the beginning of the year was 126.046 and the price was able to reach the highest level at 134.083 in June 2021. A double bottom has been formed between the months of August and September of this year. This double bottom activated the rally of $EURJPY with the current price at 132.618, 350 pips less of the previous major resistance level at 137.545, which was last seen in February 2018. The highest price of $EURJPY in the last decade was at 149.838. The Euro seems to appreciate more against the yen since the lockdown. Nevertheless, Japan and many countries have vaccinated more than 50% of their population. 

In recent times, there has been an increase in the demand for labour and skill in Europe. This was as a result of the lockdown, as many foreign skilled people are relocating to Europe. Before the dip in August and September of this year, which resulted in a double bottom, RSI showed that the price has been overbought in May 2021. At the moment, the price is already overbought on the daily chart. This could lead to a possible reversal in price as a Doji was formed yesterday and today’s candlestick shows a bearish one. If the price closes with a bearish candlestick and the next few days close on a bearish note, the price might fall to 129.261.