fbpx

CHART OF THE WEEK: YEN SURGE

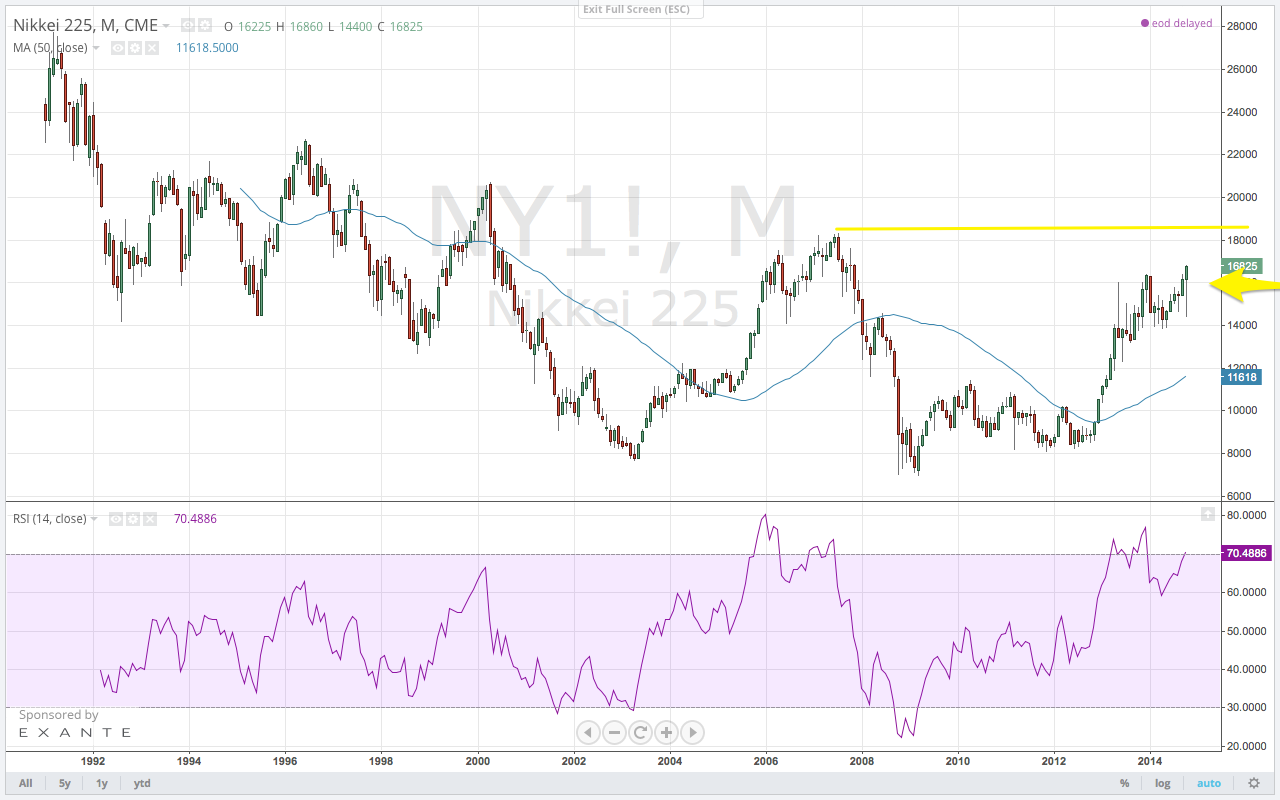
Each week, I highlight a chart out of the Quid Report.

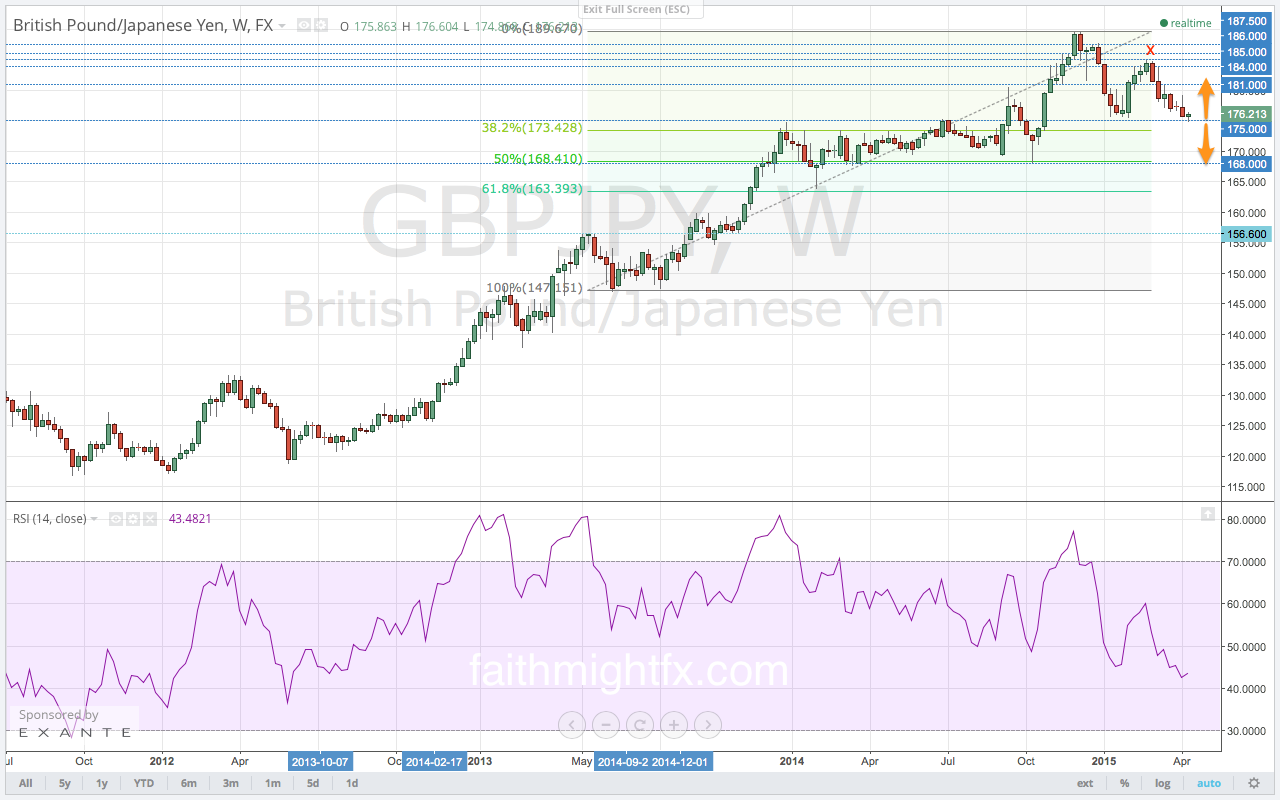
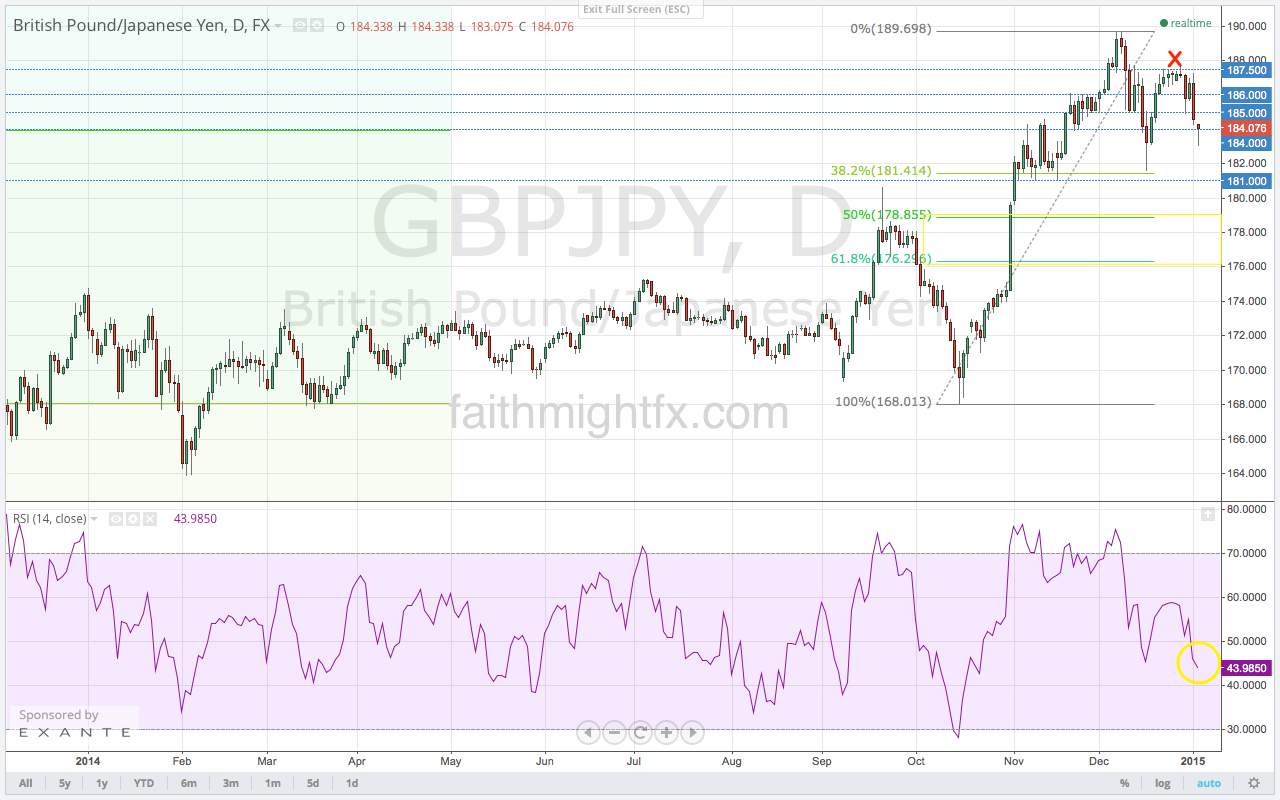
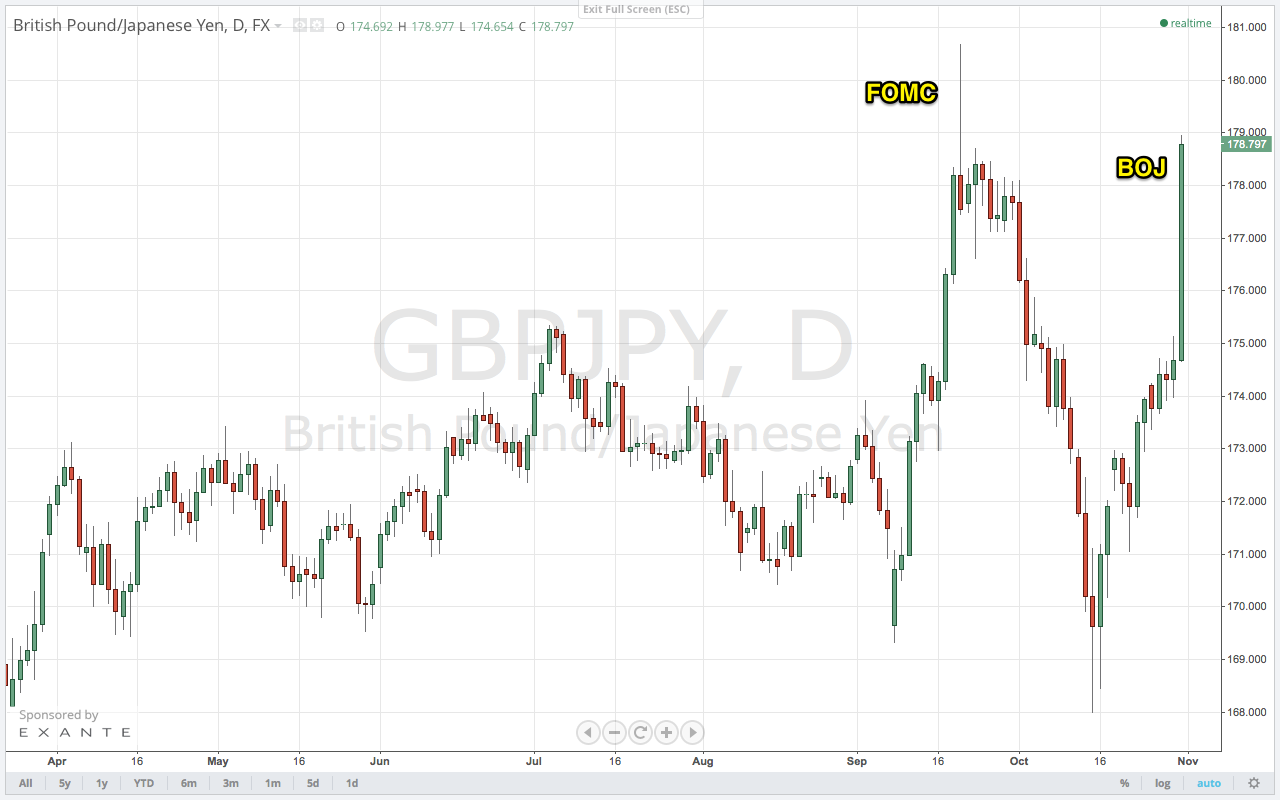
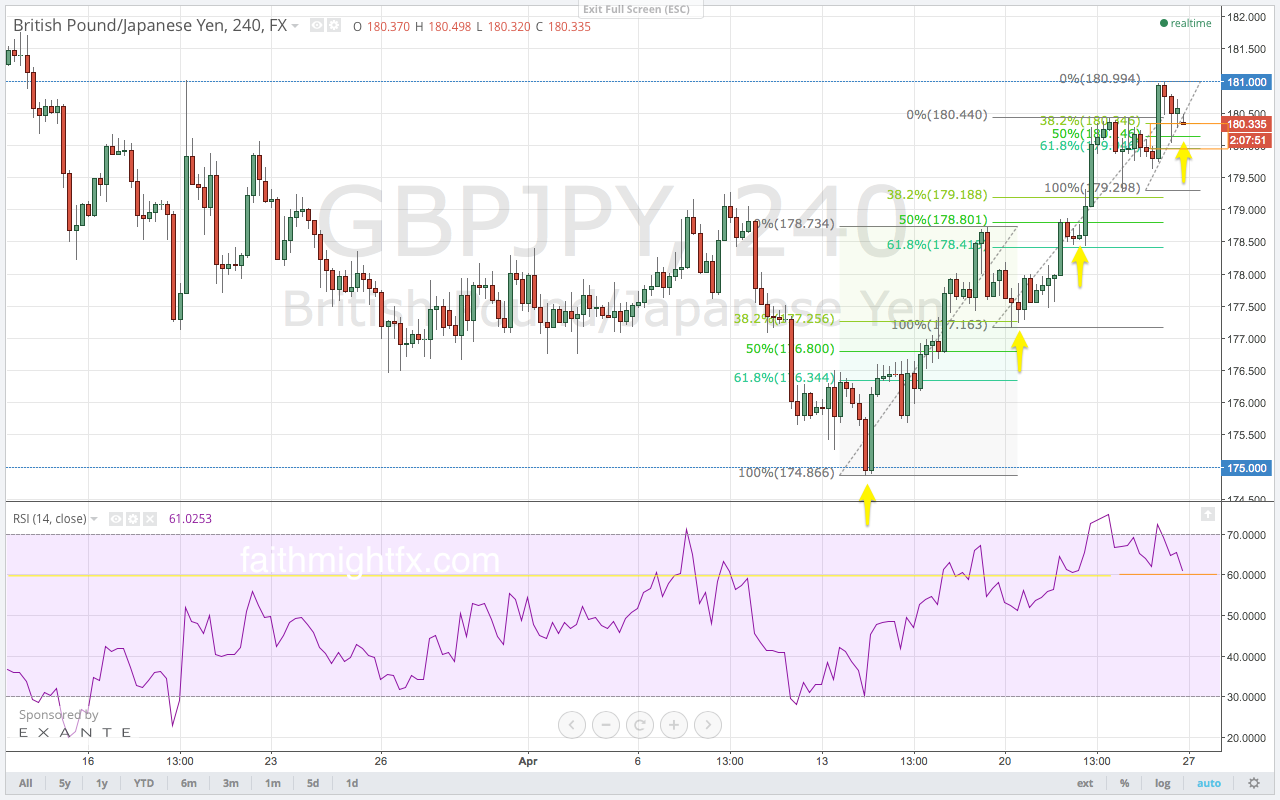
The Bank of Japan (BoJ) fueled yen weakness despite keeping monetary policy as is to maintain its massive quantitative easing (QE) program. While the BoJ does not see a need to further expand QE, they do confess that they will not meet their inflation target in 3 years. This admission gave sterling traders the green light to send the $GBPJPY back to the February highs at 184.00. This chart shows an early entry into this rally on dips back below 181.00, well ahead of when the BoJ policy statement was released.


GBPJPY 4 HOUR CHART


This is an excerpt from this week’s issue of Quid Report. Subscribers receive my research on all major GBP pairs at the beginning of the week, including access to @faithmightfx on Twitter for daily, real-time calls and adjustments to the weekly report. AVAILABLE NOW.

My Appearance on FXStreet’s Live Analysis #FXRoom

It was FOMC DAY in the #FXRoom yesterday. A big day for a big interview and Dale Pinkert (@forexstophunter) at FXStreet didn’t disappoint. We talked about the how the $FED may effect markets just a few hours later. I run through some chart art on the $GBPUSD, $EURGBP, $GBPJPY, $GBPAUD, and $GBPNZD. This is my 1st interview since launching Quid Report. So I basically talk through this week’s issue giving traders a sneak peek into my new project. Enjoy the video!

The Yen’s End Game is Nigh

The $GBPJPY broke its range and moved lower last weak. Yen strength has been relentless. With the very odd effect of QE actually having a beneficial effect, JPY has been pushing higher across the board.

After the breakout of the range to the upside fizzled, it appears that the $GBPJPY would like break lower still. This break of the range to the downside appears much more sustainable now. It is supported by momentum with the RSI still so squarely in the sell side below the 50 level. A break of 175.00 will have to be confirmed by a hold of 175.00 on the eventual bounce off new lows. A hold of 175.00 allows swing buyers to step in on an epic rally back above 181.00.

GBPJPY WEEKLY CHART

The weekly chart confirms the importance of 175.00. The 168.00 level holds a lot of weight to the downside. The 180.00-181.00 resistance zone is critical to the upside. The support level at 175.00 has finally been broken. We have our lower low due to failed highs after the previous attempt at 175.00. Bids were lined up at 175.00 as this bounce has become a reversal. To be sure, late bulls who were more tentative to step in front of the relentless JPY strength, will come in on dips.


This is an excerpt from this week’s issue of Quid Report. Subscribers receive my research on all major GBP pairs at the beginning of the week, including access to @faithmightfx on Twitter for daily, real-time calls and adjustments to the weekly report. AVAILABLE NOW.

QUID REPORT – NOW AVAILABLE

QUID REPORT

Election jitters played out in trading last week as the GBP weakened across the board. Economists and financial media took to extreme headlines about sterling volatility spiking due to the uncertainty surrounding this particular general election cycle. The GBP did slide but election jitters did not take the GBP under siege. Rather, the Bank of England (BoE) hold on monetary policy last week gave the GBP a bit of reprieve from the election selling. Without a statement from the BoE after its policy announcement, the market is left to trade on its own expectations for a series of interest rate increases out of Great Britain to begin in early 2016. However, in the past few weeks, BoE members have taken to jawboning to temper those hawkish expectations.

In addition to hawkish expectations and election jitters, trading this month is already fraught with seasonality themes….

Read the full report: Quid Report, Volume 7 (subscribers only).

CHART OF THE WEEK: YEN STRENGTH

Each week, I’ll highlight a chart out of the Quid Report.

This week it is the $GBPJPY daily chart. We had been anticipating a break of the range into support level since the beginning of the week. The $GBPJPY finally did break lower and now the big 175.00 support level looms ahead.


GBPJPY DAILY CHART


This is an excerpt from this week’s issue of Quid Report. Subscribers receive my research on all major GBP pairs at the top of the week, including access to @faithmightfx on Twitter for daily, real-time calls and adjustments to the weekly report. AVAILABLE NOW.

My Appearance on FXStreet’s Live Analysis Room

I was thrilled to be back in the #FXRoom with Dale Pinkert yesterday. He brought me in to talk all things GBP covering $GBPUSD, $GBPJPY, $GBPAUD, $GBPCAD. But he also gave me some nuggets of wisdom on the EUR via the $EURUSD giving some confirmation on the $EURGBP. The show unexpectedly became a golden example of how traders come together with different perspectives and expertises to edify one another.

I also give a sneak peek to a new service I am launching very soon. Watch out for it!

Yen Positioning for the New Year

After finding support at 181.41, the 38.2% Fibonacci retracement level, the $GBPJPY was able to stage a rally back to the 187.50 highs. However, the rally petered out before it could make a high higher than the previous 189.69 high. This leaves the bias to the downside for price action coming into this trading week. As such, price has moved lower to close last week at 184.63.

GBPJPY daily chart Jan 4 2015

With the RSI already printing a new low on Friday’s price action, price has bias to move lower still. Given that the 38.2% Fibonacci support resulted in a failed new high, I expect that the $GBPJPY make a move into the 50% and 61.8% Fibonacci levels.

However, the 181.00 support level is very formidable. If we look at the bigger timeframes, we can see that 181.00 has maintained support for price even with several false breakdowns when price trades at these current levels. Now that price has moved lower this week, 181.00 is the level to watch.

Don’t Trade Against The Central Bank

The Bank of Japan has its massive QE program well underway after announcing it almost 4 weeks ago. The central bank has committed to massively supporting its economy and markets to the decline of the JPY. With little reprieve in sight, many expect the short JPY trade to work for weeks to come.

GBPJPY daily chart

While it looks like the beginnings of a breakout as price break the top of the range at 186, the RSI is telling quite another story. This bearish divergence in the RSI relative to price gives the bull in me pause. Perhaps there is another correction lower still left in the GBP/JPY. The timing for such a correction couldn’t be better with an expected dovish outcome from the BoE this week.

Given the highs and the bearish diverging RSI readings, no new buys should be initiated at these price levels. While it is a tempting short at these resistance levels, we will not trade against the Bank of Japan regardless of the charts. Instead, the higher probability play is to set up to go long on a pullback. A close above 186.00, however, is also a signal to initiate long positions if we don’t get a move into support from here.

Another Bailout

Kuroda said the BoJ’s easing was unrelated to portfolio allocations by the Government Pension Investment Fund (GPIF), but the effect of the day’s two major decisions means that the central bank steps up its buying of Japanese government bonds, offsetting the giant pension fund’s increased sales of them.

Source: International Financing Review


Disguised as monetary policy decision to increase quantitative and qualitative easing, the BoJ basically bailed out the pension this morning. With Japan’s population aging, pension payments are coming due. Japanese equities have basically gone nowhere in the last 15 years. So pension has probably been loosing money once you consider fees paid on those assets. The Federal Reserve has basically proven to the world that QE works. We can debate the inequality of its distribution, but needless to say, the US economy is buzzing at 3.5% GDP. That’s right where we need and like to be. So the financial engineering looks to be sound and Japan has no problem using the instrument to increase wealth for its citizens too. QE today promises that the GPIF can meet its obligatory payments to policy holders AND increases the value of the GPIF’s asset holdings. Very win-win. The market likes it.

Japanese equites long term chart GBPJPY DAILY CHART

Read also: