fbpx

Sterling Digest, January 20 2013: Safety issues

Goodbye Europe. The Economist cover

Sterling has weakened considerably to kick off 2013 with several themes at play here. One is the fundamental fact that the British economy stands to enter a triple dip recession having ended 2012 with no growth. Secondly, the EU is looking  much more attractive to investors. While 2012 will be remembered as the year investor fled euros and parked their money in sterling and swiss francs, 2013 sees these same investors putting their money back in euros. Lastly, I have noticed that sterling is correlating to the USD much differently than it had in 2012. While a strong GBP saw a strong USD (and visa versa), that correlation is no longer. Now sterling is weak across the board with currencies of the stronger economies (CAD, AUD, NZD) leading the charge.

Image credit

Sterling Digest, January 5 2013: Trust the crosses

Cover artwork from The Economist 2012 Christmas double issue
Happy new year?

To kick off the new year, the global fundamentals still stink. Currency wars still rage across the globe. American politics continue to debase the world’s reserve currency. And after entering recession in 2012, the British economy is poised for depression in 2013. As terrible as the fundamental landscape seems, I agree with @kathylienfx (read her articles below). The trades that make the most sense in 2013 are the currency cross pairs. While the majors are mired in USD murkiness (fundamentals vs. risk appetite), the crosses more clearly reflect the fundamentals. And as such, these currency pairs seem to have the best trading opportunities in the current forex market environment.


Image credit


New Zealand Dollar Moving Beautifully in 2013

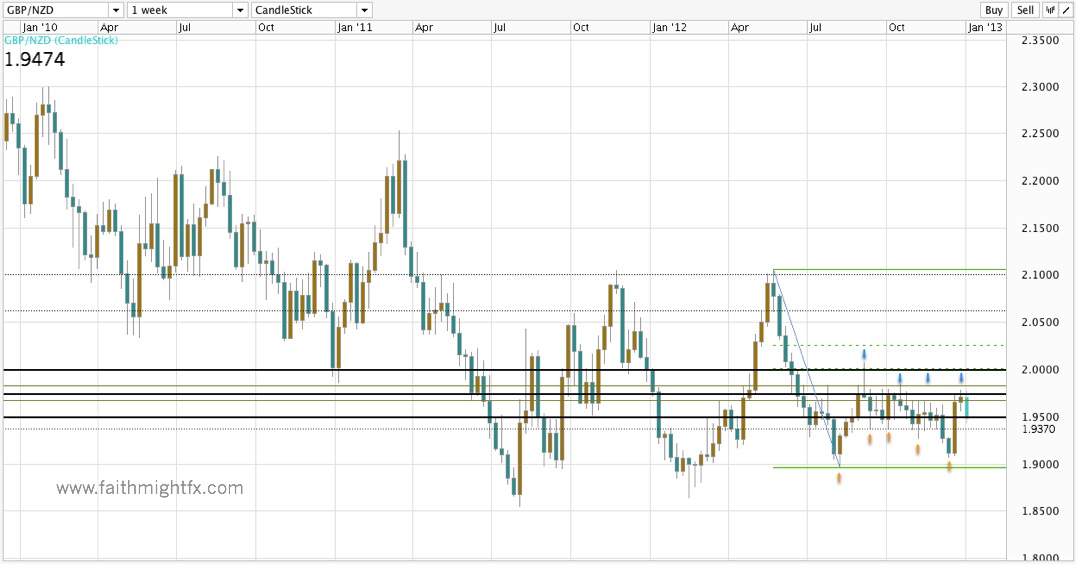
In the last quarter of 2012, the $GBPNZD pushed lower to the bottom of the channel at the 1.90 major large quarter point and psychological level. This new low broke strong support levels at 1.9370 and 1.9270. So while it certainly seemed that kiwi was staging a breakout against sterling, $GBPNZD failed to push to new lows below the previous 08/14/2012 low at 1.8962. Instead, price bounced off its channel bottom and headed all the way back to the top of the channel at 1.98.

GBPNZD weekly chart

With the range top at 1.98 holding as resistance, price moved decisively lower with spikes below 1.95 in the 1st trading day of 2013. If momentum continues, price should move lower to the bottom of the range and test support levels at 1.9370 and 1.9270.

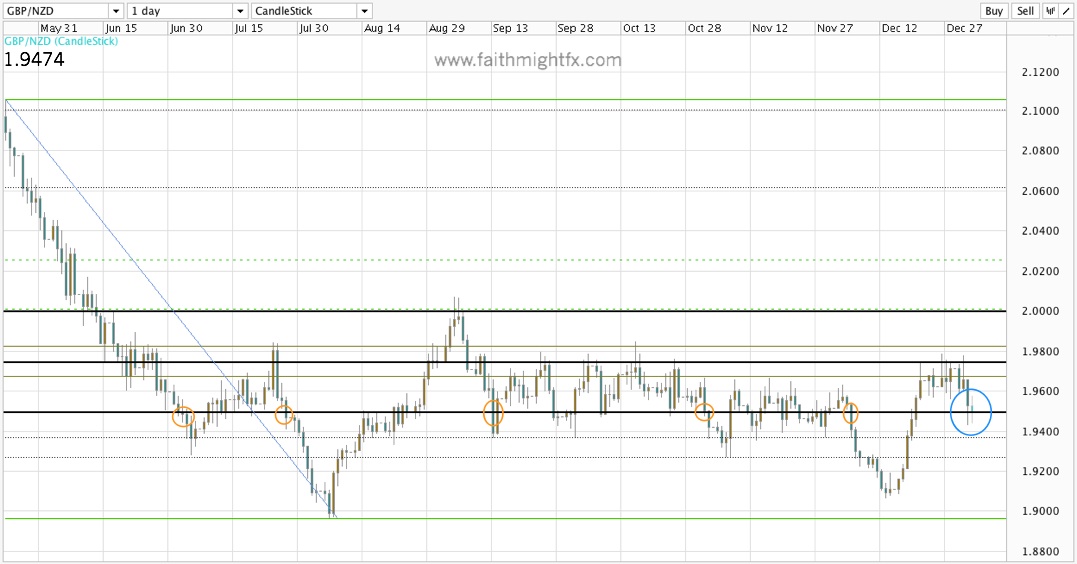
GBPAUD daily chart

Looking at the daily chart too, candle closes below 1.95 have led to more price moves lower.  So while short term momentum looks bearish, the $GBPNZD is still rangebound on the bigger timeframes.

The GBPNZD PreMarket

In the forex markets, premarket is really only early Sunday morning. With charts frozen until the afternoon open, this can be the best time to find insights before charts start ticking again.

GBPNZD weekly chart

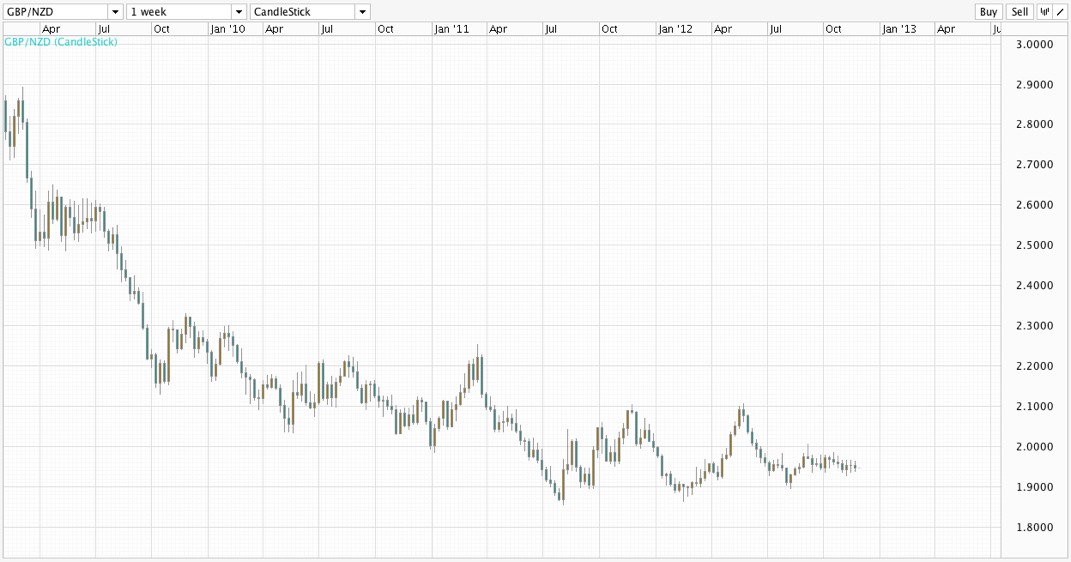
Because the $GBPNZD has not spent much time at these levels, it is taking some years for this currency pair to truly trend again.

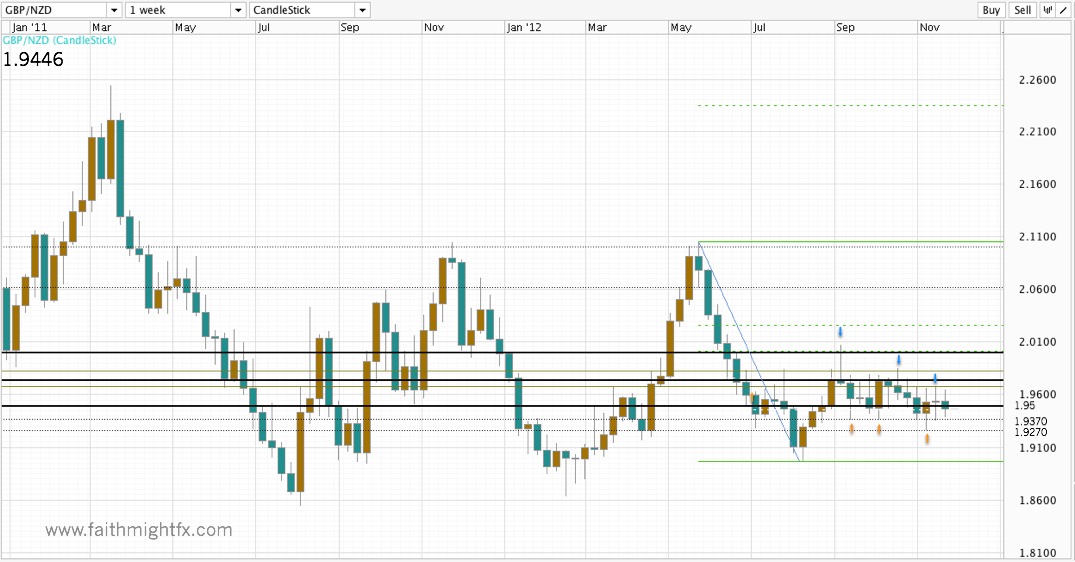
GBPNZD weekly

Zoom in on the weekly chart and we can see that this pair has been trading rangebound between 1.98 and 1.9270. Last week’s price action tested the intermediate highs at 1.9625 and closed the week in the middle of the channel below the key psychological level at 1.95. The new week open should continue momentum towards the bottom of the channel at 1.9270. That is a key level to the downside for $GBPNZD short term as it continues to consolidate the larger bear trend.

Aussie and Kiwi Diverge

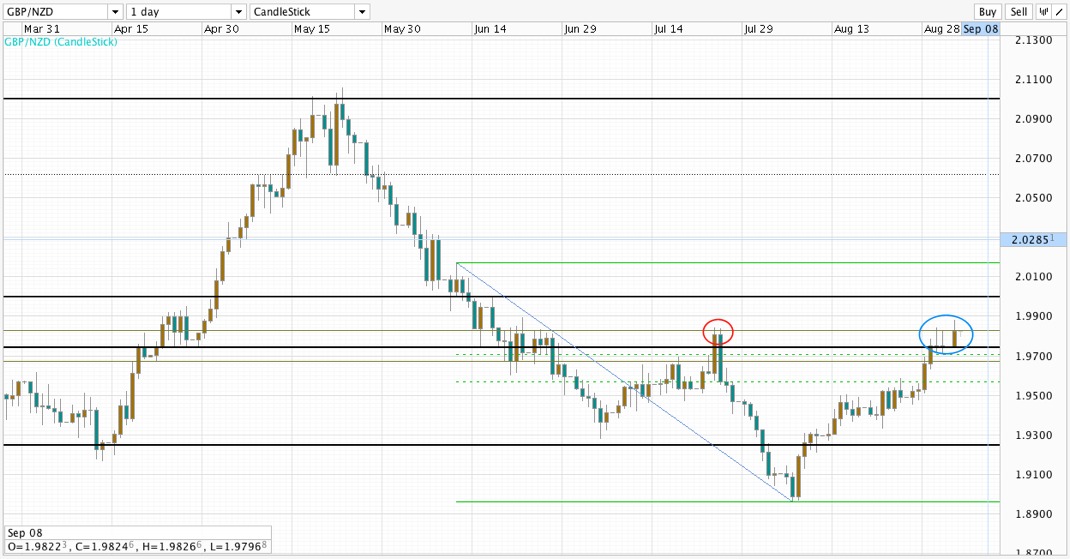
The New Zealand dollar weakened for a month and rallied the $GBPNZD to the big time 2.00 psychological level. Despite the breakout higher to 2.0050, price formed a double top at this level. Earlier this week, I stated my wariness with this sterling rally versus NZD. Kiwi fundamentals looked good on this rally. In fact, this impressive looking $GBPNZD rally was only a correction. With the 50% Fibonacci level at 2.00 holding, this pullback could make its way to new lows. Today’s break below 1.9750 signals a move lower still to 1.9500.

GBPNZD daily chart

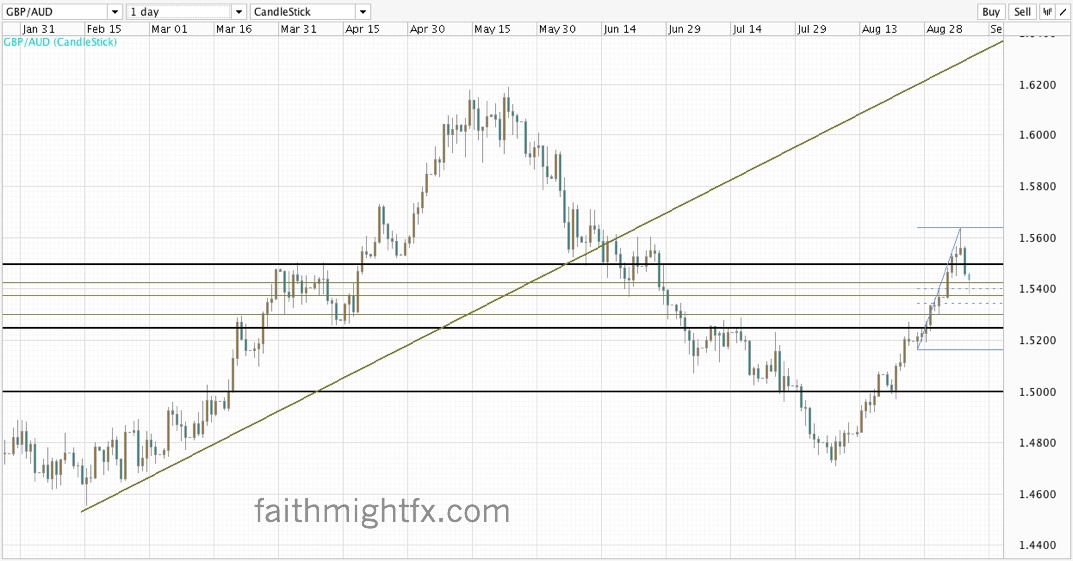
In contract, the Australian dollar is still fundamentally weak. Iron ore and copper prices are still at low levels. The global economy is still slowing. This sudden wave of bullishness didn’t change those things. The recent $GBPAUD rally was a breakout not a correction like the $GBPNZD. To me, this wk’s rally in AUD is just a correction. Now we are starting to see this divergence in fundamentals play out versus the GBP. This may only be the beginning. Trade what you see.

GBPAUD DAILY


Disclosure: Short $GBPNZD


The Quiet Kiwi

The NZD trades in the shadow of the almighty AUD and the more familiar CAD thanks to its proximity to the US. While the NZD is a commodity play, it is not a play on energy like the AUD and CAD, but on foods like dairy and cattle. Even as inflation has edged lower in many countries, food prices remain stubbornly high. The high prices in these and other agricultural commodities have gripped the NZD in a bull rally for much of 2012.

The $GBPNZD enjoyed an incredible rally in the 1st half of the year. So it seemed natural that a pullback occurred off the key resistance level of 2.10. But when the $GBPNZD broke below the major psychological level at 2.00, price broke down to new lows at 1.47. Since that low, price has marched higher. Last week, price staged a breakout above the previous high at 1.9825.

GBPNZD DAILY

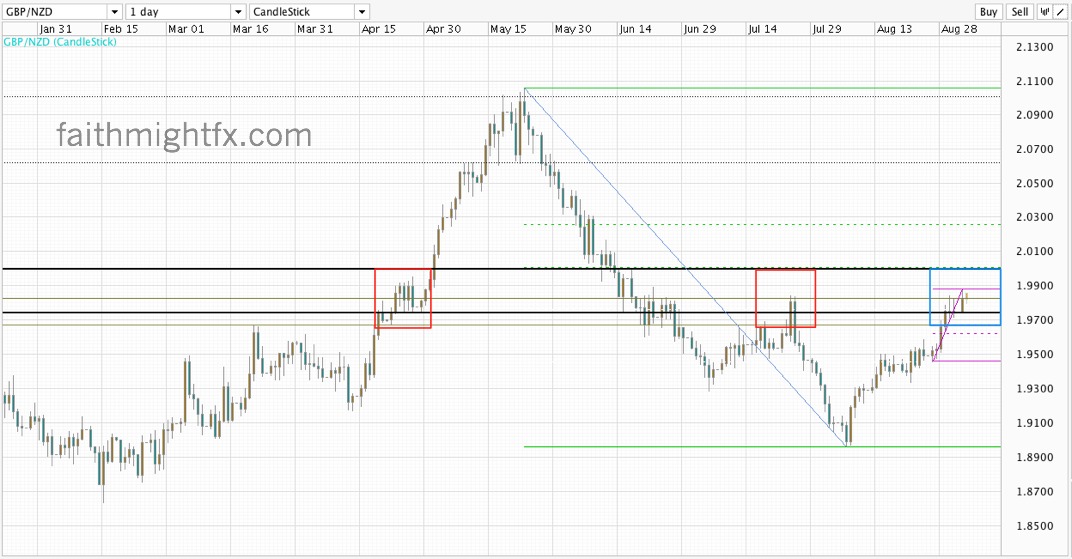
The new week open has seen price gap higher to a high of 1.9880. The pair is firmly bullish to open the new week. The key level this week is 1.9750. If $GBPNZD remains supported above 1.9750, price targets a move above 2.00. A close below 1.9750 sees price move lower below 1.95. Because the fundamentals still look strong, it will be interesting how price behaves at the 2.00 level which is also the 50% Fibonacci level of the entire breakdown. Trade what you see.

GBPNZD DAILY WITH BIG FIB


Disclosure: No position

The Temperamental USD

The USD has threatened to rally for months now. But the $GBPUSD remains in its 300-pip range between 1.5500 and 1.5800. Every time traders, and I do mean ME, gets bullish or bearish due to price action, the USD finds a way to do just the opposite.

For example, despite completing the quarter to 1.5750 on USD ($DX_F) weakness this week, cable never broke above the level to challenge the highs at 1.5800 midterm support and resistance. I was bullish cable going into this trading session. I thought price would continue to rally into 1.5750 – 1.5800 zone and then experience a sharp selloff. The selloff came sooner than expected when risk aversion kicked in as Spanish bond yields and equities spooked the market

So what happens next week? With Spanish (and Italian) yields hitting these high rates at the end of the European session, we can expect the USD to continue to rally when the market opens in Monday trading causing this “Strong USD, Strong GBP” theme to play out once again. As such, this week’s GBP bears should enjoy some profits heading into the weekend. $GBPNZD and $GBPAUD short positions, in particular, paid out nicely this week with continuations in the weak sterling vs. commodities trend. However, do not underestimate this USD. It still rules capital flows and when it is strong on risk aversion fever, GBP will also benefit in the crosses. Most notably, the $EURGBP, $GBPNZD, and $GBPCAD are strong candidates into next week. Trade what YOU see!

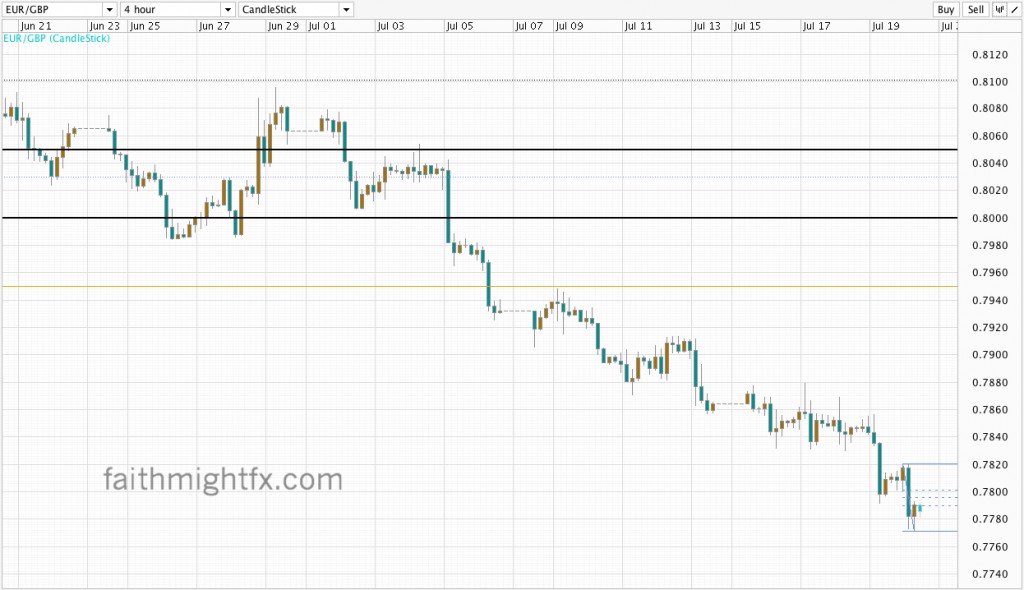
EURGBP DAILY
Looking for 0.7800 to hold on a bounce
GBPNZD DAILY
This week’s hold above 1.95 despite kiwi rally looks very good for bulls
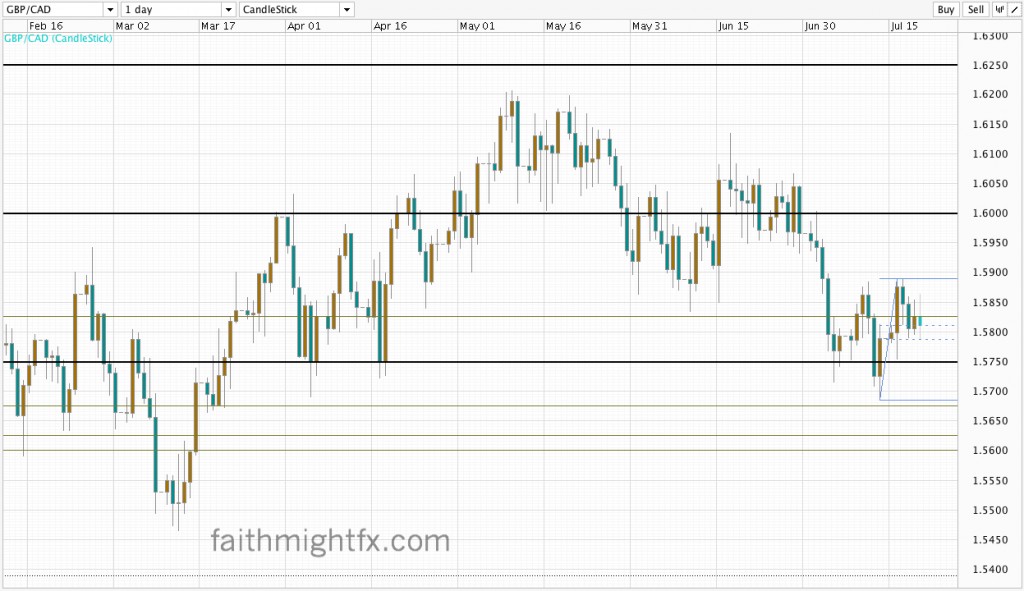
GBPCAD DAILY
A close above 1.58 supported by the 61.8 Fib gives some life to bulls


Strong USD, Strong GBP

There is a new theme emerging with the USD BREAKOUT this week. Everything is weak against USD. $GBPUSD has fallen over 650 pips in 4 weeks. It ended last week on a technical break of the 61.8% Fibonacci retracement level of its entire rally off the January 2012 lows. That was the last defense for bulls though their case was lost with price action below 1.60 for 2 weeks now. However bearish cable may be this does not at all roll neatly into a weak sterling story.

On the contrary, sterling is killing almost everything else. GBP is at multi-year highs against the euro. No secret there as to why. But the commodity dollars are also weakening tremendously against sterling on broad-based weakness in commodities. The strong USD combined with slowing Chinese growth is looking to make commodity weakness a new trend in the short-term.

When trading these markets, timing is crucial. The reason for the choppy consolidation around 1.60 in $GBPAUD and $GBPCAD is due to the sterling weakness in $GBPUSD and general GBP strength in $EURGBP and $GBPNZD. The EURGBP close below 0.80 signals more GBP strength; even as the $GBPUSD close below 1.5750 signals more GBP weakness there. The correlation is ironic. But price action is truth. The strong USD — strong GBP theme bears paying attention to as we head into summer trading.

Sterling Digest, May 23, 2012: flip-flop

Bank-of-England-Logo
Bank of England logo

Adam Posen’s flip-flop on QE makes the Bank of England more dovish especially as economic data continues to deteriorate at an alarmingly fast rate. While the $GBPUSD and $GBPJPY have been sterling weak, these pairs’ move lower is also tied to increased risk aversion. Conversely, sterling has remained very robust against the commodity dollars. Both the $GBPAUD and $GBPNZD have already made new highs on the week. Will tomorrow’s UK GDP release be the final nail in the GBP coffin?

Image credit

Sterling Digest, May 15 2012: safety status rules

50 British Pounds Sterling
Safety trumps economics

The safe haven sterling rallies on. After a dip in GBP on weak UK trade balance numbers, the $GBPAUD, $GBPCAD, $GBPNZD, and $EURGBP continued on in their strong sterling bull trend. The only currencies that gained on the safe sterling today are the almighty rulers of risk aversion: the greenback and yen.

Image credit