fbpx

The Sterling Digest, 14 February 2015: sentiment shifts

The U.S. jobs report was phenomenal. All kind of good points including a rise in the participation rate and an uptick in wage earnings. Finally! But 1 data point doesn’t make a trend. A data point that did trend this week, however, is U.S. retail sales. Retail sales in the world’s largest consumer economy missed for the second month in a row. And it missed big.

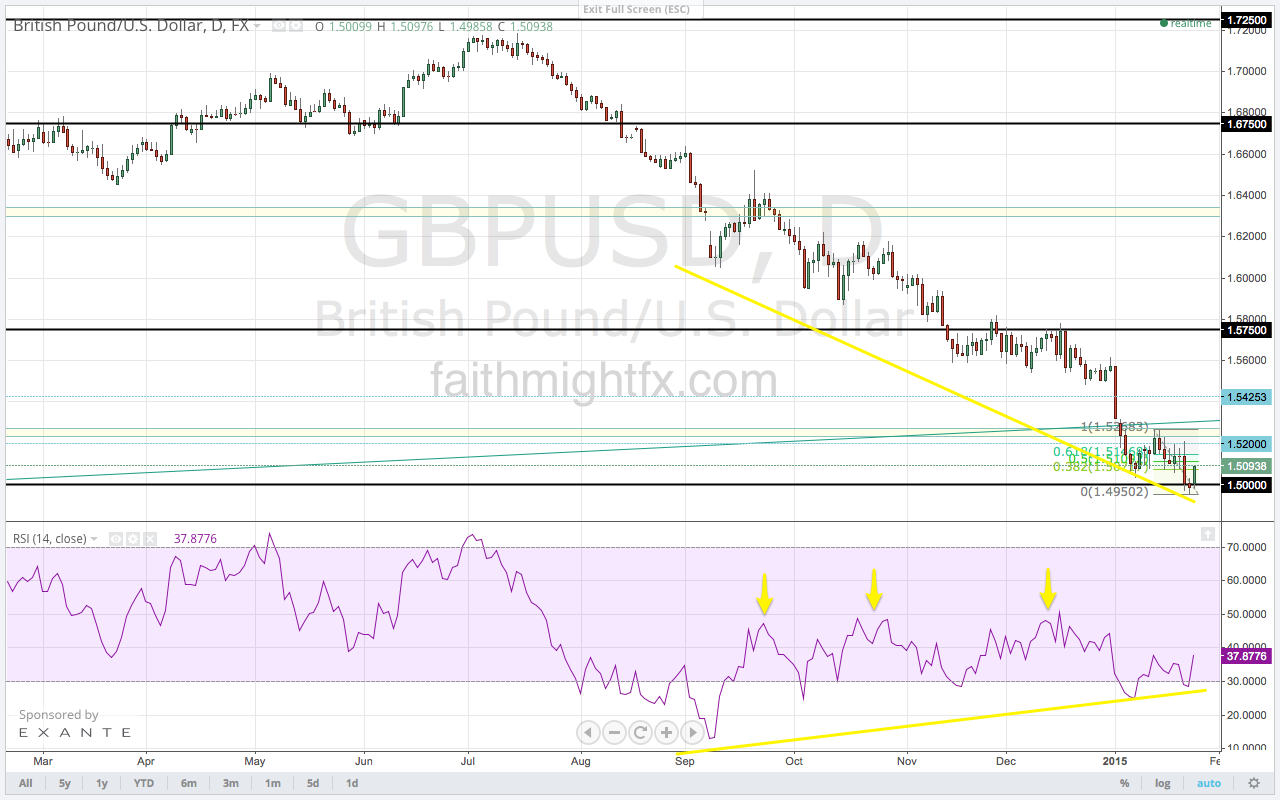
This has sent the USD to consolidate lower across the board. Even oil has managed to stage an impressive rally to close the week. Oil continues to be a major headline in the markets. It was mentioned throughout the Bank of England’s Quarterly Inflation Report. With low inflation in the UK, due to oil prices, coupled with wage growth, the BoE believes inflation to rise faster than expected. Thus, rate hike expectations have actually accelerated resulting in a renewed rally in the GBP that could drive direction in sterling pairs in the mid-term.

The Sterling Digest, 31 January 2015: central bank drama

Davos cartoon posted on Twitter
The World Economic Forum. The time of year when central bankers like to surprise.

It’s been an incredible month. Our first trading month of 2015 is in the books and it did not lack for surprises and drama. Crashing oil prices kicked off volatile trading as the new year began. The Swiss National Bank got things going with their surprise abandonment of their currency peg to the euro and interest rate cut into negative territory. The Bank of Canada surprised markets too with its interest rate cut much sooner than markets expected. The European Central Bank also managed to surprise with a larger than expected quantitative easing package. The Federal Reserve surprised markets too but in the other direction. While it did not make any changes to monetary policy, the $FED remains hawkish following Yellen’s hawkish signals in December. Finally, the Bank of England turned seemingly dovish with its hawks relinquishing their call for interest rate hikes. The incredible drama series that was January certainly sets the stage for a new normal to emerge in 2015.

Image credit

How Will The Fed Respond?

The $GBPUSD finally broke below psychological support at 1.5000 on the back of QE-induced euro selling. There is a bullish RSI divergence, however, at the lows. This is fueling the rally back to 1.5100 as the new trading week gets underway. However, it is likely to find resistance at the 50% Fibonacci level at 1.5109.

GBPUSD DAILY CHART

Traders, this week, have their eyes set to the Federal Reserve interest rate decision on Wednesday. It is likely that the $FED does nothing but it will be interesting to hear how Yellen performs during the press conference. Last month, she surprised the markets with her hawkish sentiment and the USD rallied as a result. A USD rally on a hawkish Yellen will manage to push the $GBPUSD to the lows at 1.4950.

However, it is a very different world now. The Swiss National Bank (SNB) has abandoned their currency peg in the $EURCHF, the Bank of Canada has cut interest rates, the Danish National Bank cut interest rates twice in a 1 week, the Central Bank of Nigeria has restricted USD buying versus the naira and the European Central Bank (ECB) has started in on a €1.1 trillion quantitative easing program. These unprecedented and surprise moves by the world’s central banks have likely been in response to the SNB or the ECB or both. So how will the $FED respond? The US central bank is not likely to enact monetary policy based on what others are doing or not doing. With Yellen hawkish but the rest of the FOMC fairly dovish along with the rest of the world, Wednesday will be a very interesting trading day and will likely dictate direction in the USD for the following trading sessions.

Given the chart, any rally in the $GBPUSD on a weakening USD seems well contained by the Fibonacci levels and the former support-turned-resistance zone. Trade what you see.

My Appearance on FXStreet’s Live Analysis Room

I was thrilled to be back in the #FXRoom with Dale Pinkert yesterday. He brought me in to talk all things GBP covering $GBPUSD, $GBPJPY, $GBPAUD, $GBPCAD. But he also gave me some nuggets of wisdom on the EUR via the $EURUSD giving some confirmation on the $EURGBP. The show unexpectedly became a golden example of how traders come together with different perspectives and expertises to edify one another.

I also give a sneak peek to a new service I am launching very soon. Watch out for it!

GBP Weakness Just Getting Started in 2015

Happy new year! And it certainly has been a good one so far for GBP bears. On the last trading day of 2014 (December 31) and the 1st trading day of 2015 (January 2), the $GBPUSD completely broke down. Economic data out of the United Kingdom has done a complete turnaround from the economic data of 2013. Friday’s manufacturing data missed and sterling broke support nearly across the board. The weakness continued this week with a miss in both construction and services PMI. Both releases are sending sterling lower still against every major currency.

GBPUSD daily chart on Sunday Jan 4

Until Friday’s breakdown, the limited downside was very restricted by the bullish diverging RSI that had been developing since September. But price didn’t care at all about the diminishing selling momentum as $GBPUSD continued to probe new lows. Now that price has broken down again to new lows, we see that momentum is finally following suit. The momentum of Friday’s price action has broken the bullish trendline on the RSI. This break lower in the RSI suggests that $GBPUSD will continue to fall lower. But remember that nothing moves in a straight line. A bounce is very possible as price heads into 1.5150, 1.5100 and 1.5000 support levels. Trade what you see.

Divergence Sets The Opportunity

The $GBPUSD has finally breached the 1.6000 level even closing last week below the big psychological level. It is a level that marked the 50% Fibonacci level of the 2013 rally in cable. Since Friday’s break, however, cable has managed to stage a small, corrective rally back above 1.6000 as high as 1.6130. And despite the pullback from those 1.6130 highs, there is still potential for $GBPUSD to see higher levels on this bounce.

GBPUSD DAILY CHART

This RSI divergence here on these new lows suggest that this bounce should continue higher into the Fibonacci levels. The 1.6250 level is historically a huge resistance level. Price could also get a boost higher with the release of the FOMC meeting minutes today and the Bank of England monetary policy decision tomorrow. If so, any rally higher becomes as an opportunity to set up for further weakness in cable. The RSI and data releases may give swing traders opportunity to set up at higher, more attractive levels before another push below 1.6000. Bears should be patient and bulls should not get too giddy. Trade what you see.


Majors Meltdown

Ivaylo Ivanov of SocialLeverage50 tweeted this sweet currency chart this morning before the US open. With 1 more day until it ends, it pretty much sums up the entire 3rd quarter of 2014.

stocktwits chart posted by ivanhoff
Everything at their chart extreme except for pound

Which surprised you the most? Sterling has been pretty resilient to the USD strength as it found favor in the face of a majors meltdown. The currencies of the G10 all melted this quarter and all to pretty significant support levels. Except for the pound sterling. Even the mega rally in the USD is at a significant resistance level. Is GBP a laggard? Or the exception? A signal of future strength in the currency? Or future weakness?

Source: Image credit

The Aftermath of NO Vote

So the United Kingdom has avoided divorce and remains united after all as the Scots voted against independence last Thursday. The market has responded with massive sterling strength across the board. In fact, we have breakouts in the $GBPJPY, the $EURGBP, and the $GBPNZD as the weakness in the cross currency serves to exacerbate these rallies.

The $GBPUSD, however, may not rally like its cross pairs. This relief rally in cable is still a corrective rally and will likely meet resistance at the 1.6750 resistance level. Furthermore, there is confluence at this major level as the 61.8% Fibonacci level of the entire decline also falls at this level.

GBPUSD DAILY CHART

Before the 1.6750, I’d expect offers to come in at 1.6500 and 1.6620, the 50% Fibonacci level. But it is the 1.6750 level where bulls will ultimately have to prove themselves.

Trade what you see.

The Scottish #IndyRef

IMG_4150.JPG

My first reaction was that market doesn’t care about my take so why would I have one. Each day, I attempt to approach the markets with humility because I don’t want to fall in love with a bias that will beholden me to a position. But if I’m really honest with myself, of course I have a take on the referendum!

I don’t think the Scots will go through with it. And if I’m right the market will flail about for a few hours, or days, and go back to trading the status quo. And the stays quo is that the economy is not as strong as it was a year ago. Wage growth, the new forward guidance, is tepid at best. No matter what Carney says, I don’t think he can convince a majority of the MPC to raise internet rates until there is more proof of inflation beyond house prices. In fact, the weakness in commodities actually buys the BoE some time as energy prices are even less of a drag on inflation than they’ve ever been before.

If the Scots prove me wrong and vote in independence, then the pound sterling will weaken fast and sharp across the board. A currency crisis will literally materialize in a matter of hours as markets deal with a sudden GBP currency union or a new Scottish currency.

So, in conclusion, my take is bearish GBP. But I know the markets can do whatever they want to do. So whatever you do with this “insight”, please do mange your risks appropriately and trade what you see.

Read also:

Image credit