fbpx

SPX Continues To Hit New Highs

After 67 years of the being founded, the S&P 500 continues to hit new highs. The S&P 500 Index, also known as the Standard & Poor’s 500 or the US500, is an American stock market index that tracks the performance of the top 500 companies listed on the Nasdaq Stock Market or the New York Stock Exchange. It is a free-floating index covering US firms with the largest market capitalisation and book value, representing approximately 80 per cent of the total value of the country’s equity market.

As of December 31, 2023, the market cap was SPX was US$42.0 trillion. As of June 28, 2024, the nine largest companies on the list of S&P 500 companies accounted for 35.8% of the market capitalization of the index and were, in order of highest to lowest weighting.

Some of the largest companies included in the S&P 500 Index today are Microsoft, Nvidia, Apple, Amazon.com, Meta Platforms, Alphabet and Berkshire Hathaway.

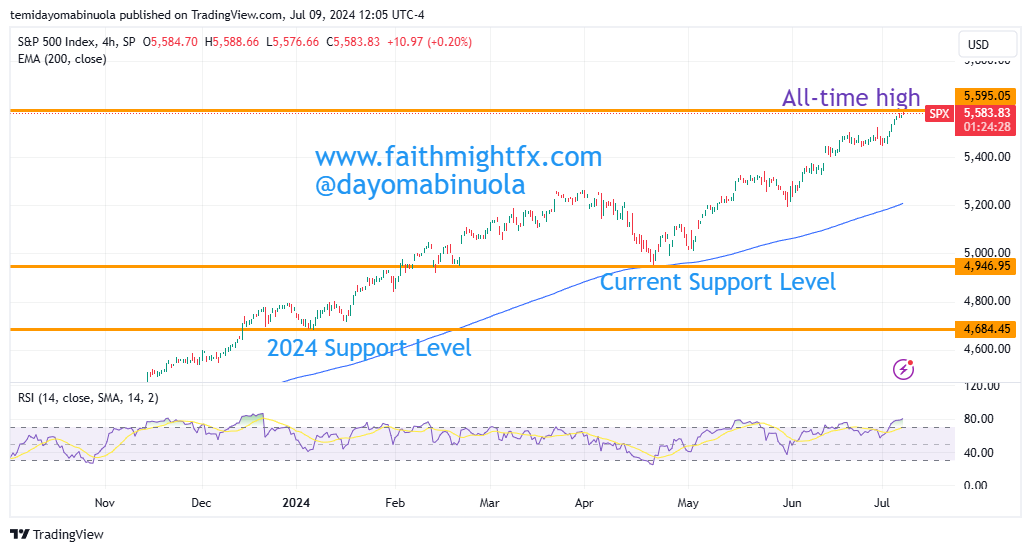
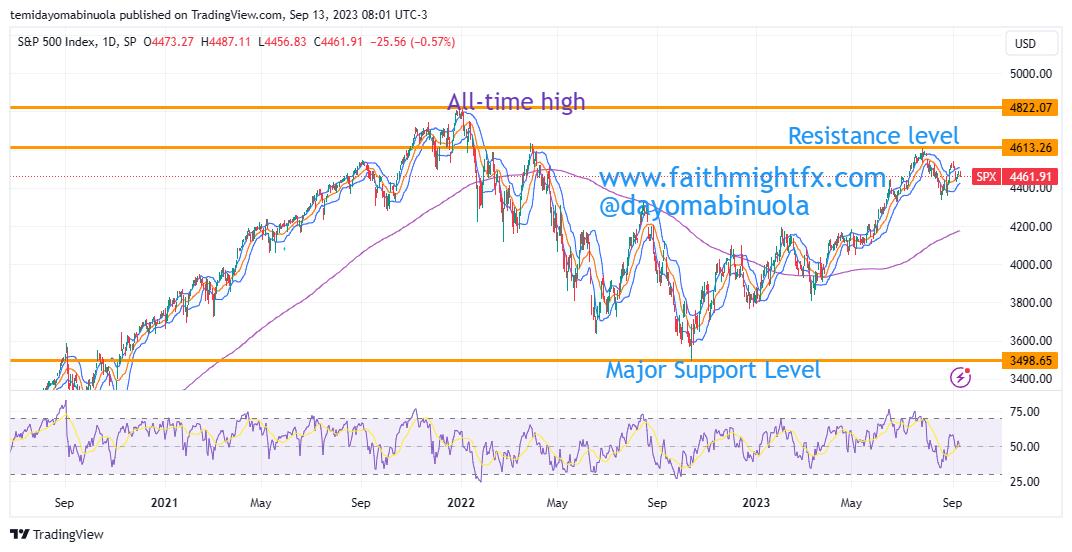
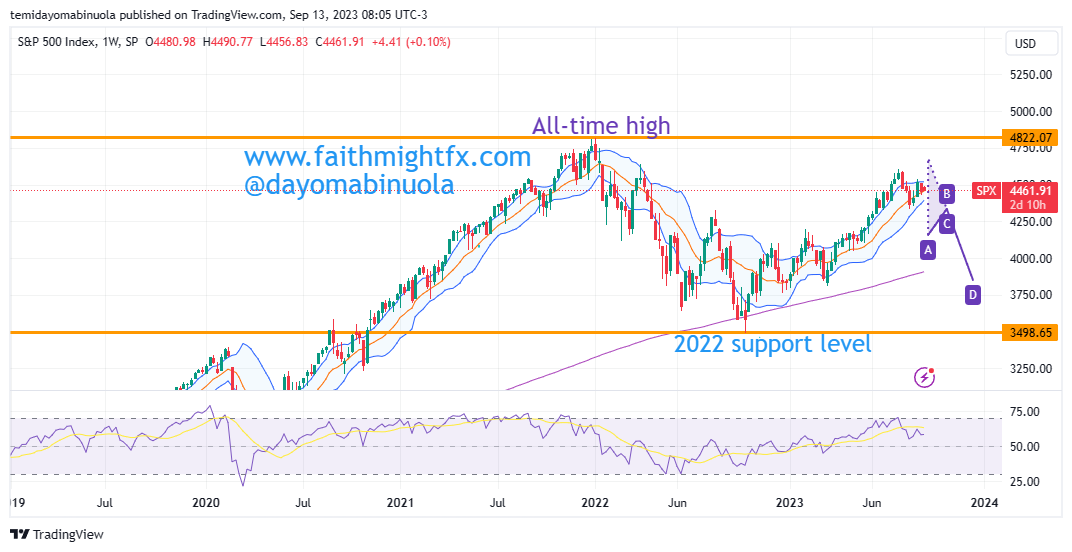
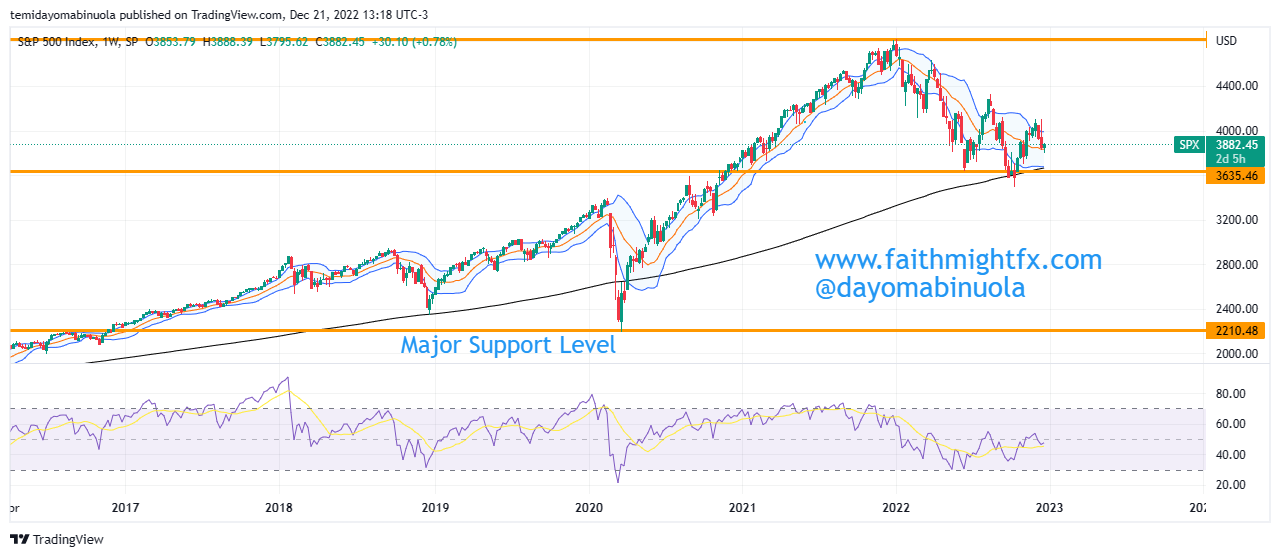
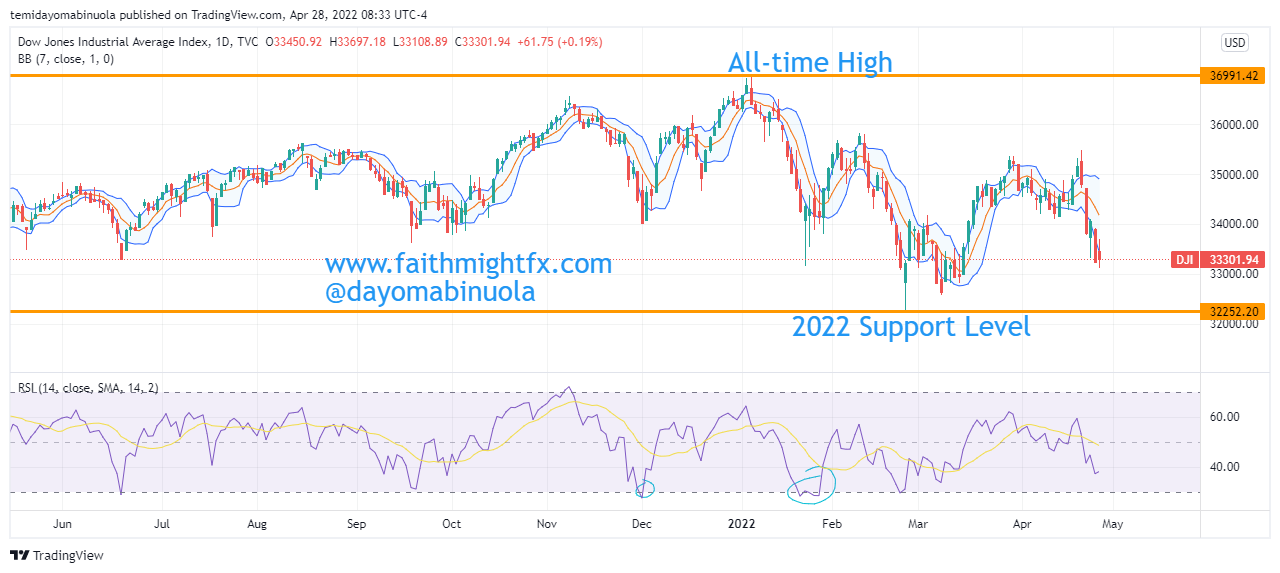
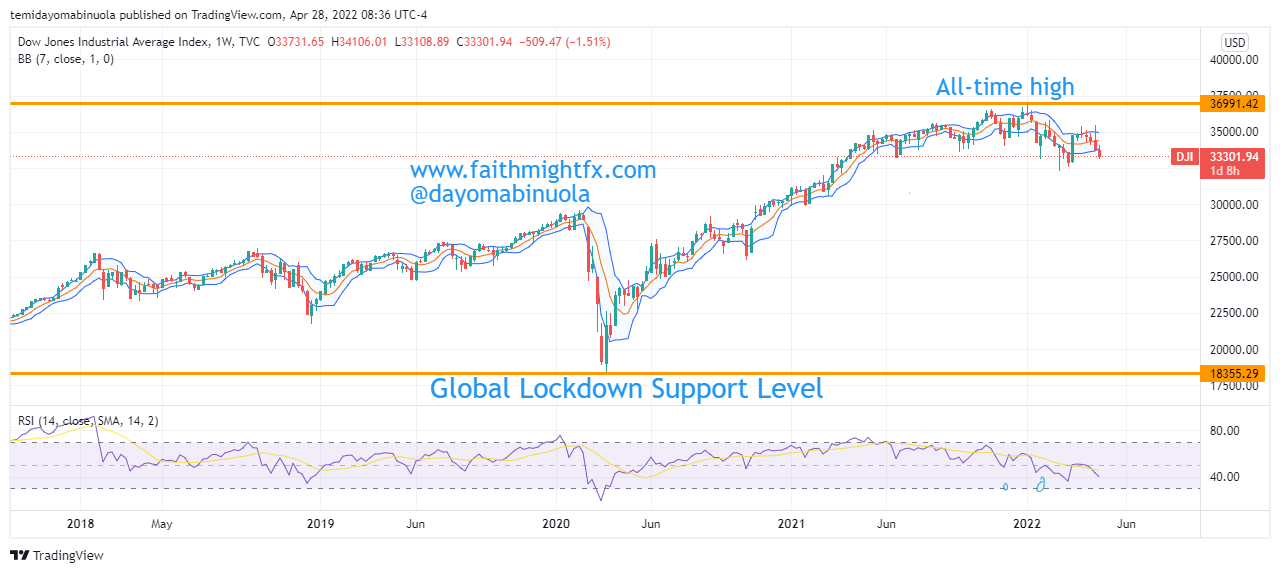
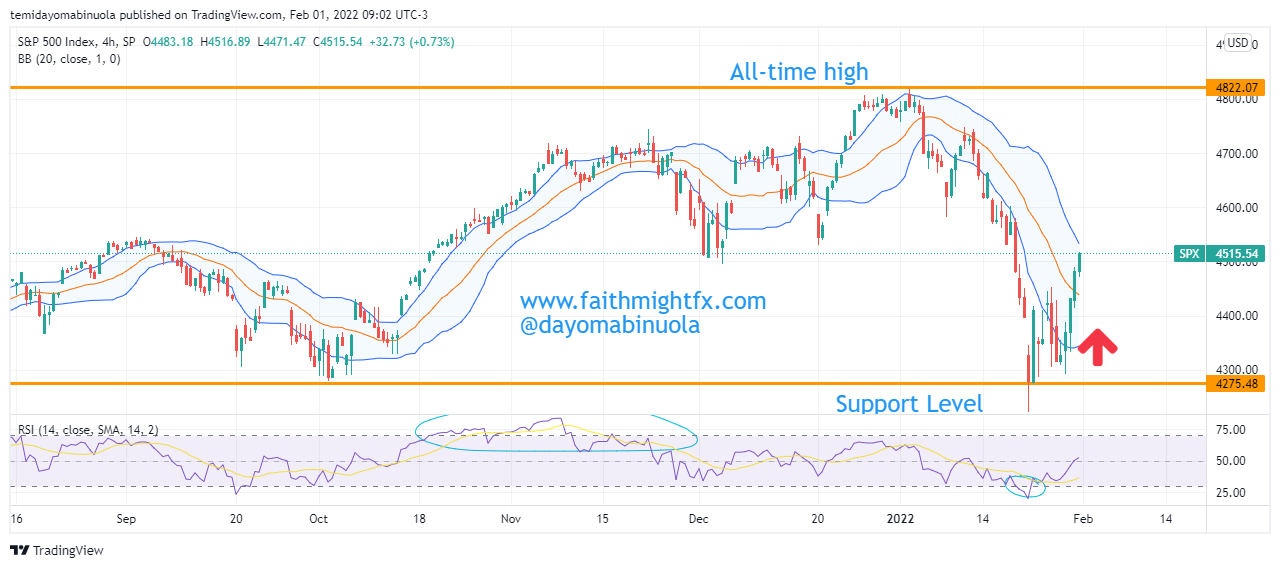
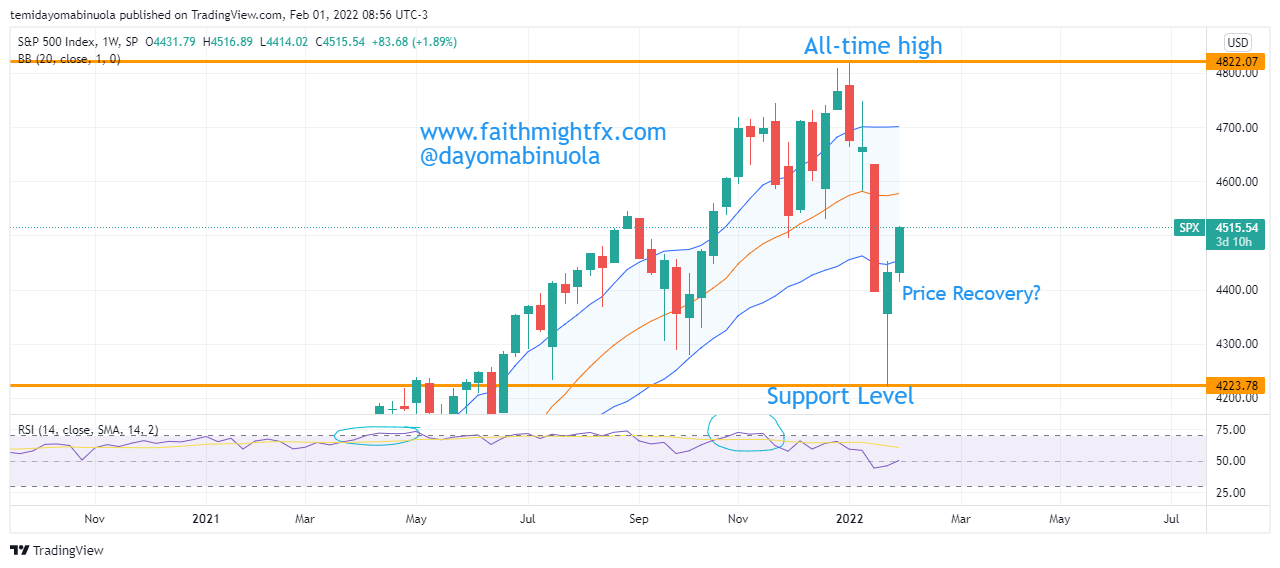
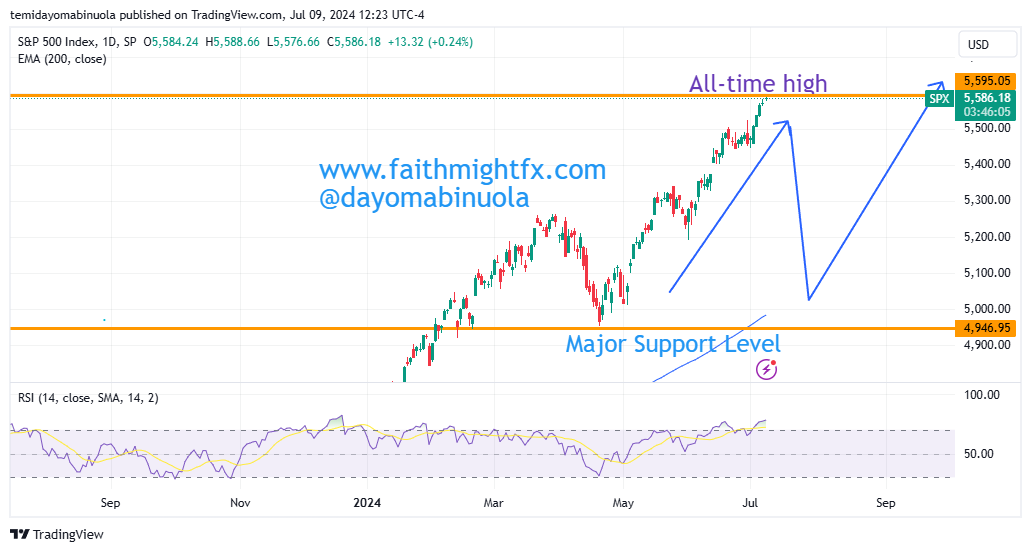
The opening price of SPX this year was $4744. Each month of this year, the SPX index has been reaching new highs. Today, a new high was reached at $5,588. There are two instances on the weekly chart using the RSI that price had been overbought. A correction in price should have occurred but the bulls are very much active with the rally. A reversal in price might occur as price might hit $4988 in the coming weeks.

Some of these ideas are in our clients’ portfolios. To understand if this one can work for you or for help to invest your own wealth, talk to our advisors at FM Capital Group. Would you like more information on how to get stock index in your portfolio? Schedule a meeting with us here

SPX To Rally Above $4,500 Again

The stock index has gained over 600 points in 2023 despite a huge fall in 2022. After the price of SPX reached an all-time high of $4822 on the second trading day of 2022, the bears took charge as price reached $3493 – the lowest price of SPX since November 2020. SPX in the next one year has the potential of rallying past $4700. However for now, we might see a short-term rally, after which we might see price falling below $4000 in the coming months.

On the 27th of July 2023, the price of SPX reached a 2023 high at $4613. There was a correction after this milestone was reached. The correction made price fall to $4341 on the 18th of August. Price of SPX at $4341 currently stands at a temporary support level. The bulls have been able to push price higher. The current price of the S&P 500 stands at $4461. We might see a rally in the coming days above the psychological level of $4500.

Some of these ideas are in our clients’ portfolios. To understand if this one can work for you or for help to invest your own wealth, talk to our advisors at FM Capital Group. Would you like more information on how to get stock indicies in your portfolio? Schedule a meeting with us here

FTSE 100 Continues To Dip

On the 4th of January 2023, we wrote an article on our outlook for FTSE 100 in 2023. In this article, our analysts concluded that there will be a rally in 2023 which will lead to a breakout of the 2022 resistance level of 7682. The breakout occurred in January 2023. After price broke out, the rally continued as FTSE 100 reached an all-time high of 8040 in February 2023.

The value has continued to drop since the price reached 8040. As of the time of publishing this article, FTSE’s price has fallen to 7268 which is lower than the opening price of the year which was 7457. This indicates that all gains in 2023 have been lost. Based on our analysis, we might be seeing price of FTSE 100 bounce above 7600 in the coming weeks.

Some of these ideas are in our clients’ portfolios. To understand if this one can work for you or for help to invest your own wealth, talk to our advisors at FM Capital Group. Would you like more information on how to get stock indicies in your portfolio? Schedule a meeting with us here.

The Global Market Perspective In 2023

The Global Market Perspective in 2023

Global economic activity is experiencing a broad-based and sharper-than-expected slowdown, with inflation higher than it’s ever been in several decades. The cost-of-living crisis, tightening financial conditions in most regions, Russia’s invasion of Ukraine, and the lingering COVID-19 pandemic all weigh heavily on the outlook. Global growth is forecasted to slow to 2.7 percent in 2023 from 3.2 percent in 2022. This is the weakest growth profile since 2001 except for the global financial crisis and the acute phase of the COVID-19 pandemic.

Taking a look at a few of the markets in 2023:

1. Nifty 50: This is a benchmark Indian stock market index that represents the weighted average of 50 of the largest Indian companies listed on India’s National Stock Exchange. Nifty 50 had a bounce from the lockdown lows in 2021. This appreciation continued in 2022 as price reached an all-time high at 18900 in the last week of November. The first half of 2022 was dominated by the bears until July when the bulls pushed price to a new all-time high. in 2023, we might see Nifty 50 below 15000.

NIfty 50

2. FTSE 100: This is a share index of the 100 companies listed on the London Stock Exchange with the highest market capitalisation. Just like Nifty 50, the FTSE 100 bounced from the pandemic lows. The FTSE 100 ranged between 7600 and 7682 in 2022. We might see a breakout of the resistance level of 7682 in 2023. 

FTSE 100

3. DAX: The DAX is a stock market index consisting of the 40 major German blue-chip companies trading on the Frankfurt Stock Exchange. The DAX rallied in 2021 from a 2022 low of 8288 to an all-time high at 16278. The first three quarters of 2022 were bearish until October as the bulls pushed the price of DAX upwards. The price of DAX could reach a new all-time high in 2023. 

DAX

4. NIKKEI 225: The Nikkei 225 is the stock market index for the Tokyo Stock Exchange. The Nikkei measures the performance of 225 large and publicly owned companies in Japan from a wide array of industry sectors. The Nikkei 225 shows that it could reach a new all-time high in 2023. 2023 might just be a year to recover losses incurred in 2022 as a result of the activities of the bears. 

Nikkie 225

5. S&P 500: The S&P 500 is a stock market index tracking the performance of 500 large companies listed on the stock exchanges in the United States. The year 2021 ended as the SPX reached an all-time high at 4822. The year 2022 was not a good year for the SPX investors. The year 2023 could be a year of recovery and SPX could reach a new all-time high.

SPX

Some of these ideas are in our clients’ portfolios. To understand if this one can work for you or for help to invest your own wealth, talk to our advisors at FM Capital Group. Would you like more information on how to get stock indices your portfolio? Schedule a meeting with us here

Dow Jones Falls Below $34,000 Psychological Level

Dow Jones experienced a comeback rally after the global lockdown of 2020 was eased. As of January 2020, the price of Dow Jones was at $21,618. Price was able to reach a new all-time high on January 5, 2022, at $36,991 which was close to the $37,000 psychological level. Ever since this year’s high was reached in January, Dow Jones bears have been aggressively active. Attempts by the bulls to push the price higher have been overpowered by the bears.

Daily Chart

This year’s support currently stands at $32,296 which is over $4,500 lower than the all-time high. In March 2022, the price rallied to $35,368 which was March’s high. After March’s high, the bulls couldn’t push the price further upward as the bears seized back the momentum and caused the price to dip to $33,103. However, the price has risen a bit and is currently at $33,301.

Weekly Chart

RSI on two different occasions has shown that the price has been oversold on the daily timeframe. Despite these indications, the bulls have failed to push the price above $36,000. However, our analysts forecast that the bulls in a couple of weeks might manage to push the price to $35,000 and even beyond.

Some of these ideas are in our clients’ portfolios. To understand if this one can work for you or for help to invest your own wealth, talk to our advisors at FM Capital Group. Would you like more information on how to get stock indices in your portfolio? Schedule a meeting with us here.

S&P500 Bounces After The January Dump

A huge selloff has occurred in the price of $SPX since the beginning of this year after the market opened on the first trading day of the year at $4784.65. On the second trading day which was on the 4th of January, the price reached a new all-time high at $4817.87. The bearish confirmation was on the year’s third trading day after $SPX lost over 80 points in a day.  The month of January was bearish for $SPX after its loss of over 260points, which was almost a 6% loss from the year’s opening price of $4776.61. Just like the American market, the European and the Chinese markets had a poor January as the market was majorly bearish. In January, $SPX had the worst month since March 2020. Our analysts forecasted the price drop of $SPX in one of our articles in January 2022.

4hr Chart

The sell-off in January was due to the Fed signaling its readiness to tighten monetary policy, including raising interest rates multiple times this year to tame inflation that has shot up to the highest level in almost 40years. The $SPX has been a bull market over the decades. The sell-off in January was a normal correction expected in a bull market. The correction of $SPX made the price hit the lowest price in January at $4221.07. A bounce from the dip occurred in the last week of January as a Doji was formed, which could lead to the beginning of price recovery. The bulls are beginning to gather momentum as the price closed at $4505.15, about 7% price appreciation from the January low. As the bulls begin to become more active, the price could reach $4805.68 in the coming weeks. Price has currently crossed to the upper region of the Bollinger bands on the 4hr chart. 

Weekly Chart

In the 12 months of 2021, $SPX had a new all-time high in each of them. $SPX has continued with a new all-time high in January before the dump. Will a new all-time be reached in February?

Some of these ideas are in our clients’ portfolios. To understand if this one can work for you or for help to invest your own wealth, talk to our advisors at FM Capital Group. Would you like more information on how to get venture capital in your portfolio? Schedule a meeting with us here.