fbpx

Zoom’s Share Price Falls Further

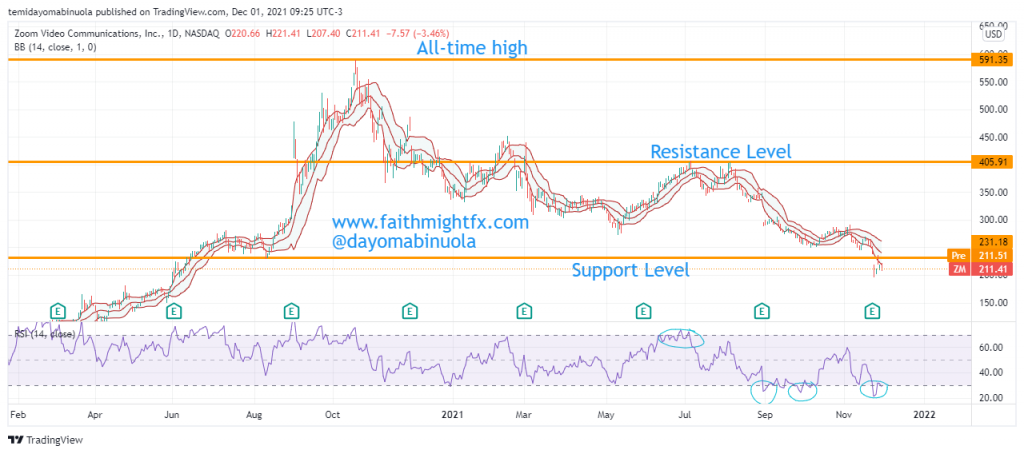
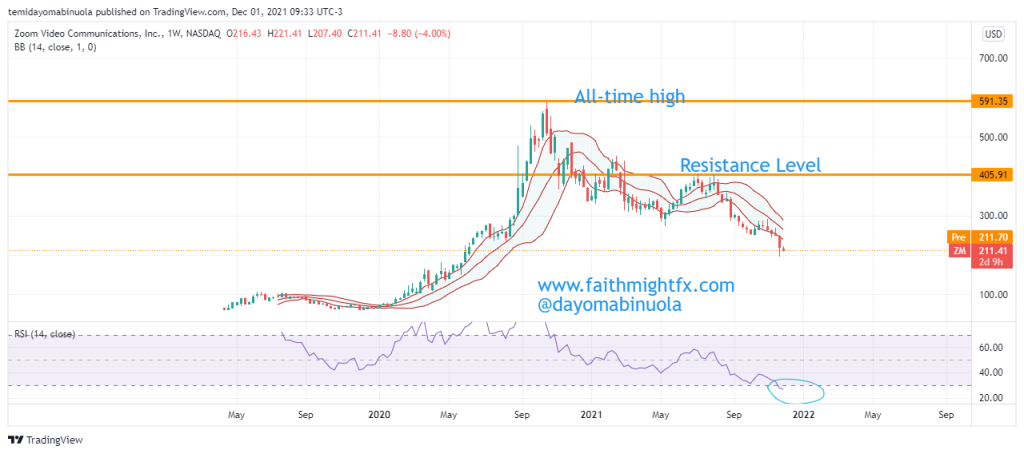
Zoom’s investors had a good return in 2020 after the price opened at $67.23 to reach an all-time high of $588.21, which is over 8X. During the lockdown, many meetings and conferences were held virtually as Zoom was the favorite of many organizations. However, 2021 is the worst year for $ZM investors since its IPO in 2019. The opening price for Zoom this year was $337.07. As offices began to open due to the mass vaccination of people in different countries across the globe, the price of Zoom began to fall. The hope that showed in July 2021 as a result of the monthly candlestick was dashed away when all gains were lost in August 2021.

Daily chart

The current share price of Zoom is at $218.79 which shows that Zoom investors have lost 35% from the opening price of this year. A breakout to the downside has occurred from the August 2020 support level at $233.23. Is this going to be a continuous downtrend? The next few weekly candlesticks will determine the next direction. The share price of Zoom is currently at the lowest since June 2020 at $211.41. There are tendencies that the share price of Zoom might rise to $400 as many countries begin to lock their borders due to the new cases of the Omicron variant of the coronavirus. As countries begin to lock borders, this might eventually affect the workspace. Companies might fall back to the remote ways which worked during the lockdown.

Weekly chart

Some of these ideas are in our clients’ portfolios. To understand which ones can work for you or for help to invest for your own wealth, talk to our advisors at FM Capital Group. Would you like more information on Investment Advisory, Portfolio Services, and VC? Schedule a meeting with us here.

Twitter Has Lost All Its 2021 Gains

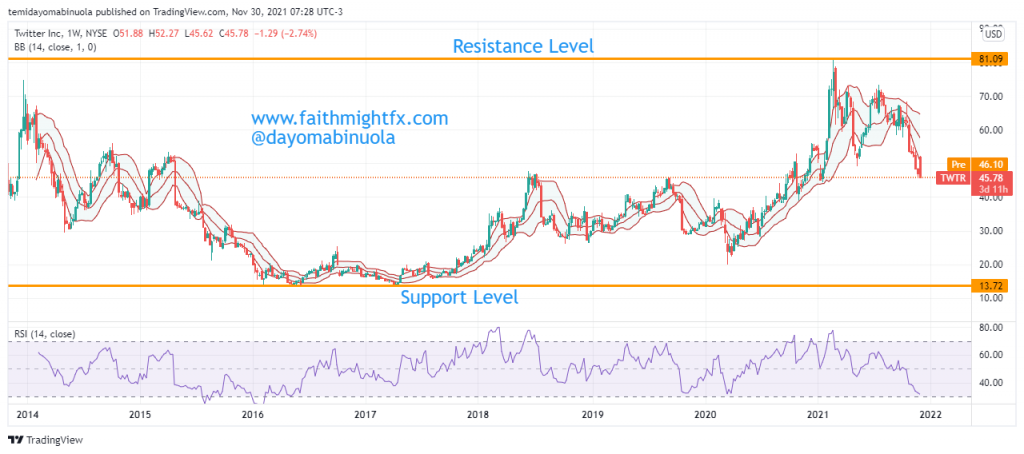
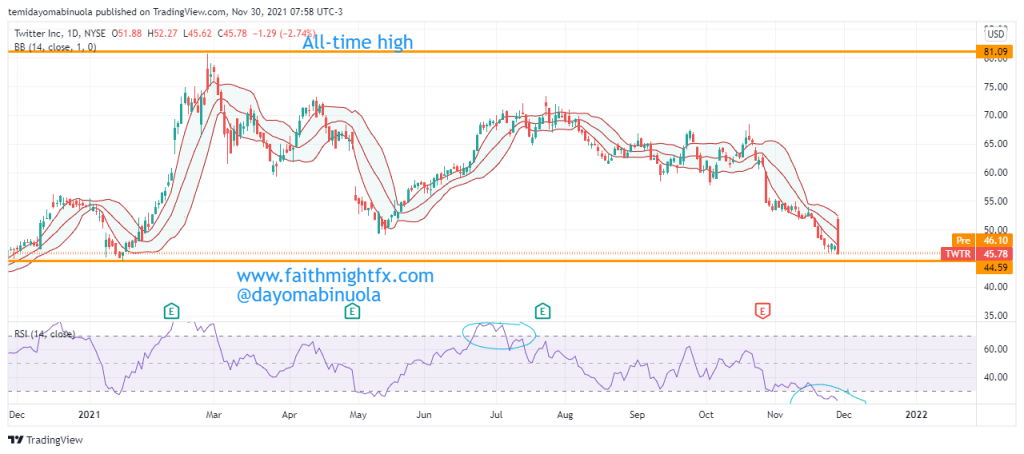
Twitter’s opening price at the beginning of 2021 was $54.22. Later in the first month of the year, the price fell to the lowest level in the year at $45.59. After the price fall to $45.59, the price rallied in February 2021 to reach an all-time high at $81.09. Since the all-time high was reached, prices began to go lower. There have been lower lows and lower highs, which has resulted in huge losses as all the $TWTR gains of 2021 have been lost. Twitter is currently at a -16% loss from the opening price of the year.

Weekly Chart

After Thanksgiving Day, the market opened at $46.54 and closed at $47.10. But on the 29th of November 2021, the price had a gap up from $51.84 which showed a bit of hope until Jack Dorsey announced his resignation as the CEO of Twitter. The share price of $TWTR closed at $45.78 yesterday after Parag Agrawal was announced as the new CEO of Twitter. Price is currently around the year’s support level at $45.59. RSI is currently at the oversold position even after the price is around the support level.

Daily Chart

The gap up at the opening of yesterday’s share price for Twitter made the price reach the upper region of the Bollinger Bands, but the price crossed lower to the lower region of the bands at the close of the market. There may be a call for the bulls as a new CEO is appointed. A few Indian-American CEOs have emerged as the CEOs of American Tech Companies, and their share prices have been doing excellently. As the Twitter bulls become more active, the price might reach $66 in the coming weeks.

Some of these ideas are in our clients’ portfolios. To understand which ones can work for you or for help to invest for your own wealth, talk to our advisors at FM Capital Group. Would you like more information on Investment Advisory, Portfolio Services, and VC? Schedule a meeting with us here.
Boeing Maintains The Same Support Level

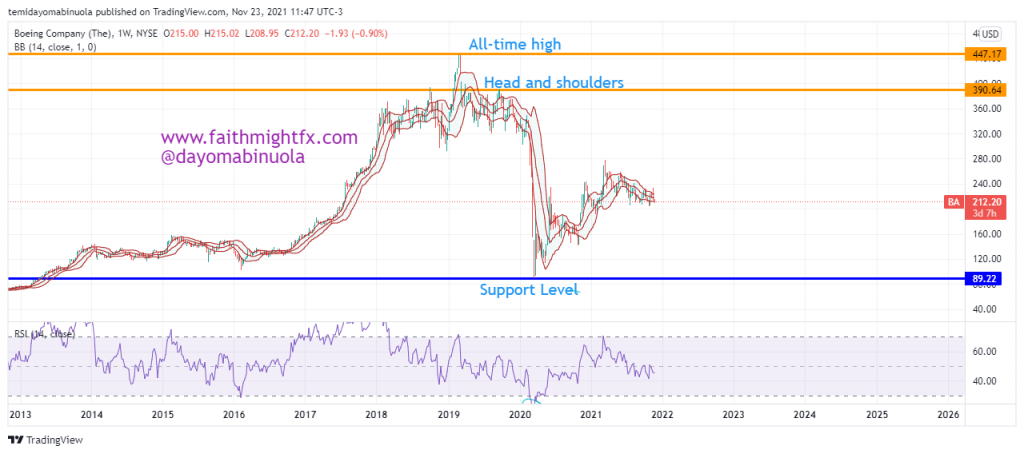
Boeing has maintained the same support level at 205.15 since it broke out of the resistance level in November 2020. This breakout led to the price rally which reached $278.38 in March 2021. 2021 has maintained a strong resistance at $278.38. Price has failed to reach the resistance level since march, instead, the price has touched the support level at least three times. In this month of November, the price has broken the trendline to the upside, which could be an indication of a possible rally to the resistance level at $278.38. The breakout of the trendline lasted for a few trading days before the price dipped to $211.00, which is the current price of $BA.

Before the dip in March 2020, which as a result of the pandemic, the price of $BA reached an all-time high at $447.17 in March 2019. After the all-time high, the price dipped to $89.22. The fall was the worst fall since $BA went public losing about 80% of its value. In March 2020 after the lockdown has been eased, and the airline industry began operation globally, the $BA share price begins to appreciate. The market closed yesterday at $211.00. The price of $BA could appreciate to $267.59 in the coming weeks as the holiday and vacation season resumes.

Some of these ideas are in our clients’ portfolios. To understand which ones can work for you or for help to invest for your own wealth, talk to our advisors at FM Capital Group. Would you like more information on Investment Advisory, Portfolio Services, and VC? Schedule a meeting with us here.
Facebook Changes Name, Share Price Might Rise

Facebook Inc has been in the middle of a crisis for a while, which has negatively affected the share price since the beginning of September. On the 28th of September, Facebook Inc changed its name to “Meta Platform Inc”. There is a new technology named metaverse, which is termed surround-yourself technology, the CEO is committed to developing the technology, which I believe must be one of the reasons for the name change. The social network name is still called Facebook. Also, the leadership of Facebook Inc remains unchanged.

4hour Chart

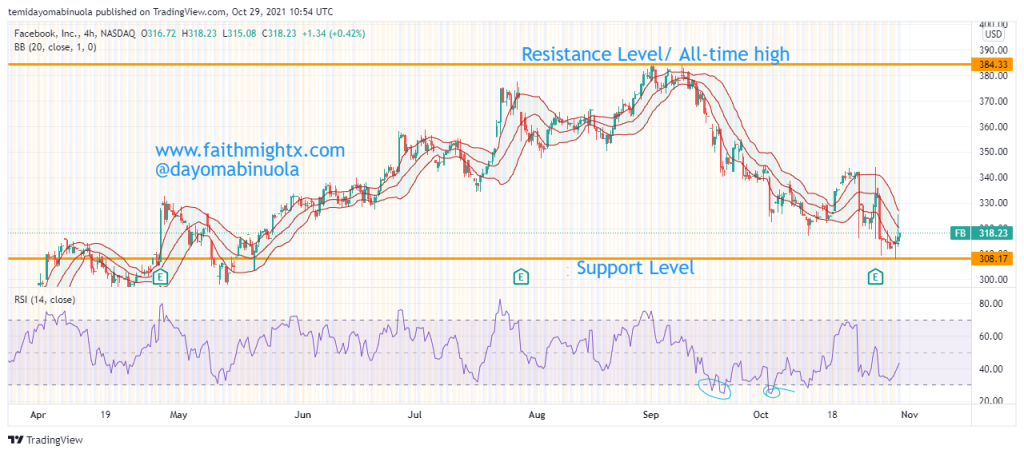
The metaverse brings the internet to life or is rendered in 3D. Zuckerberg has described it as a “virtual environment” you can go inside of, instead of just looking at it on a screen. People can meet, work and play, using virtual reality headsets, augmented reality glasses, smartphone apps, or other devices. It has been said that Facebook will spend $10billion this year on the new technology. RSI has shown two oversold positions in September and October on the 4hour chart, after the dip in September. An upward breakout of the trendline occurred this October before the dip continued to reach new support at $308.17. The price movement shows the bulls broke the trendline again. With the introduction of the metaverse, Facebook might begin a major bullish movement back to the all-time high at $384.33

Daily Chart

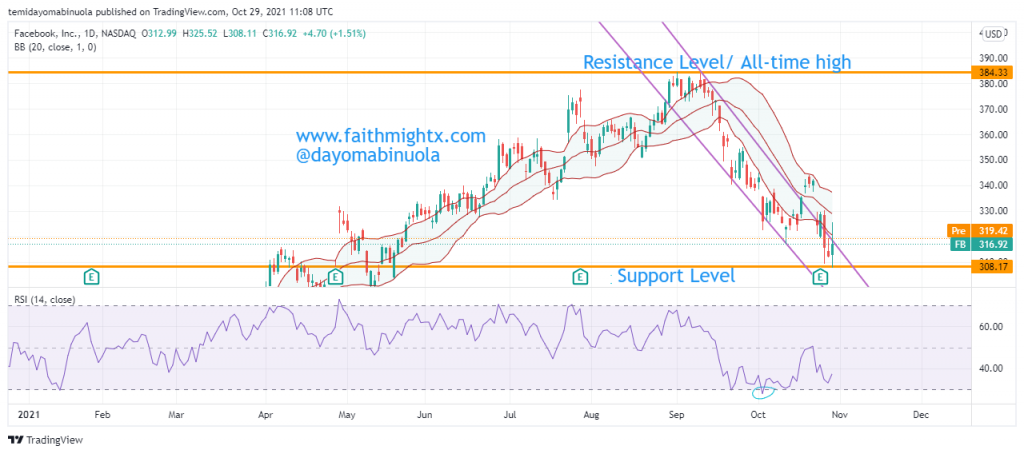
The Daily chart shows it clearly that all profits made in the second half of this year have been lost as a result of the recent dip in September. Yesterday ended a bullish note as the Facebook name was changed to Meta.

Boeing’s Share Price Consolidates

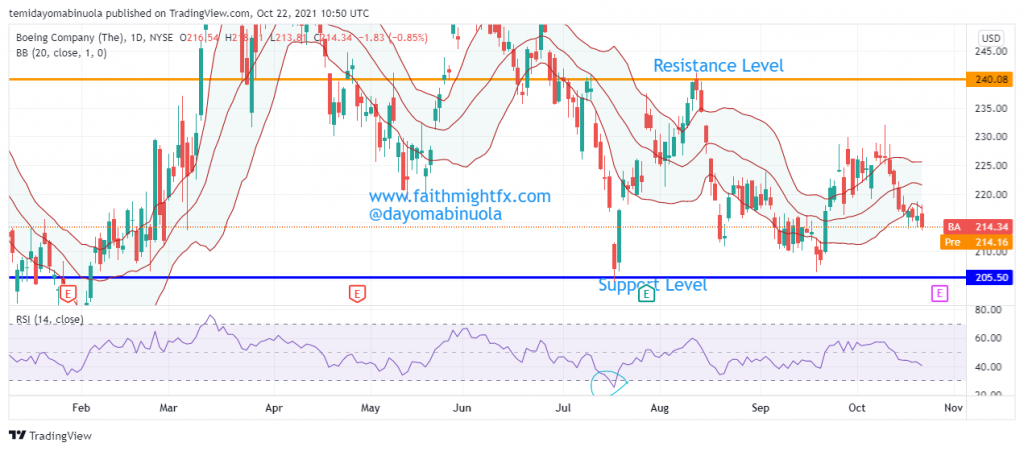
The share price of Boeing opened at $209.91 at the beginning of this year. Price rallied to $272.98 on the 15th of March, 2021, which makes it the highest level $BA reached since the pandemic began. In 2019, Boeing’s share price reached an all-time high at $445.62. After the all-time high was reached, a head and shoulder was formed, which resulted in a dip to the lowest level at $90.29, which was during the pandemic. The current price of Boeing is at $214.34, which is almost falling to the year’s opening price at $209.91.

RSI showed that the price has been oversold in July 2021 at the support level of $205.50. After the dip in July, a rally occurred temporarily, the price has been consolidating around the support level since the second half of this year. The price of $BA has not really favored investors in this month of October as the price has been falling continuously. Consolidation of price is around $214.34 which could lead to the next rally towards $230. As countries across the world increase the administration of vaccines, there might be a huge rally, which is as a result of an increase in international flights globally, which might break the resistance level at $240.08 to the upside.

Facebook Share Price Broke The Support Level

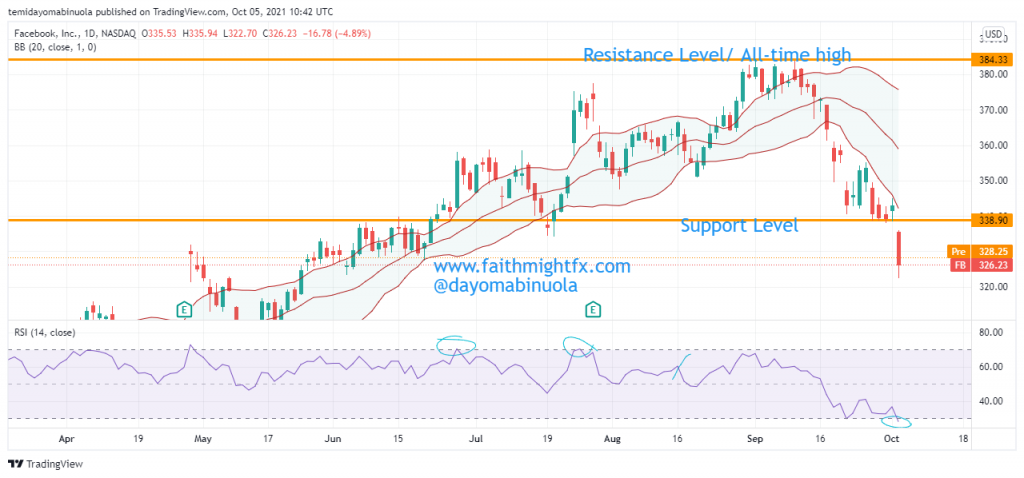
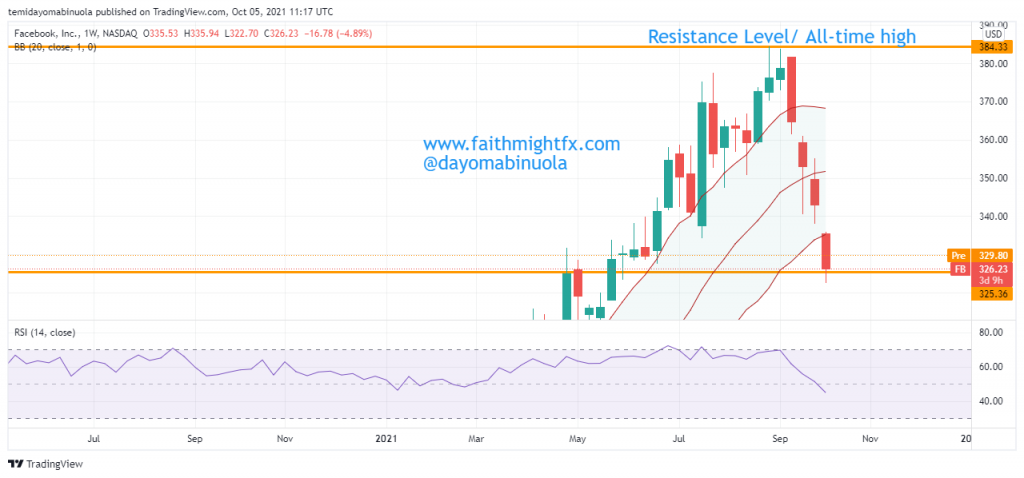
The Facebook share price has been enjoying a smooth ride as the bulls were able to take the price to an all-time high in September. After the all-time high was reached at $384.33, the price fell to $338.90. For the past 4 trading days, the price has been consolidating around the support level at $338.90, but the unusual happened yesterday as there was an outage. This outage affected the three-platform owned by Mark Zuckerberg i.e. Whatsapp, Facebook, and Instagram for about 6hours. Bloomberg gathered that the global service outage that kept its social media apps offline for much of Monday on a problem with its network configuration, adding that it found no evidence that user data was compromised during the downtime. 

The $FB market opens at $335.75 yesterday and the price went as low as $322.25, but the market closed at $326.23. There is a rise in the pre-market price as the price is currently at $328.25. Taking a looking a weekly chart, the price was already overbought on the RSI, the outage only brought about a correction in price. The last 3 trading weeks show the price of $FB has been falling prior to the outage. A gap down occurred at the end of the second trading week in September, price is yet to retrace to the gap down. Also, yesterday’s opening price was after a gap down. Investors should be hopeful, as the price could retrace in the coming weeks to the second, then the first gap down.

The share price of $FB is currently at the lower region of the Bollinger bands. As normalcy is restored to the various platforms owned by Facebook Inc, we hope the price of $FB will begin to rise.

Facebook Share Price Dips

Facebook is an American online and social media and social networking service owned by Facebook Inc. In Facebook’s 17years of launch, the social networking site has about 2.85billion users as of 31st March 2021. $FB’s investors have had a rewarding year as the opening price was at $259.20. The price was able to reach $384.33 this September before a correction began. The correction has pushed the price lower to $340.65 at the close of the market yesterday. After the price reached a new all-time in June 2021 at $341.74, $FB share price has continued to rally. The new support level is around $341. The bears were able to push the price lower in July, but it was a fake-out of support at $341.

Despite RSI showing that the price has been overbought at three different times on the 4hr chart, there was an oversold indication in the past few days. The candlesticks still maintain the lower region of the Bollinger bands. There are tendencies the bulls might become very active soon, thereby appreciating the price of $FB. Since the acquisition of Whatsapp in 2014, Facebook has increased its price by a 5X growth rate. Also, price appreciated furthermore after the dark mode was launched on mobile devices. The share price might be boosted as Facebook expands the metaverse initiative with $50million.

Boeing Ready for A Rebound

After the lockdown made the airline industry lose billions of dollars as a result of planes being grounded, the ease of lockdown gave up to the airline industry as jobs were restored and the tourism industry try to regain its balance. Also, the Boeing 737 max was grounded worldwide between March 2019 and December 2020. This was a result of the two crashes that claimed 346 lives. The Boeing 737 Max was recalled across the world due to a series of failures. The tourism industry has been badly affected by the pandemic, but hope might be rising as vaccines are being administered across the world.

Since the ease of lockdown, the $BA daily chart has been showing higher lows and higher highs. As the price is currently at $212.14, we expect a bounce. We are hopeful the price will appreciate in the coming weeks as Boeing delivers 22 jets in August, 737 MAX ‘white tails’ nearly gone (yahoo.com). RSI has continuously shown that the price has been oversold in the past few days. A $BA price rally above $234.90 could occur, as the trendline has been broken to the upside. Also, the company claims that Boeing’s Aircraft Demand Forecast Bullish Despite Short-Term Headwinds (yahoo.com), as the press release, shows the demand for 19,000 new commercial aircraft with a book value of $3.2trillion over the next 10years.

Alibaba Share Price Is Beginning To Rise

The price of many stocks fell in 2020 during the global lockdown. For Alibaba, it’s the reverse. The lowest price of $BABA in 2020 was at $170.17, in March. The lockdown brought about an increase in the share price of Alibaba.  Alibaba is a Chinese multinational technology company specializing in e-commerce, retail, Internet, and technology. Shops and malls were locked during the lockdown, e-commerce companies like Alibaba was a good substitute. Price rallied to an all-time high at $319.56 in October 2020 from the lowest price at $170.17. in March 2020. Since there was an ease of lockdown, the price of Alibaba in 2021 has been falling.  

Since February 2021, RSI has shown 3 instances of the price being oversold. All gains made during the lockdown and post lockdown have been lost. The price is currently at $167.22. The last time the price of $BABA reached $167.22 was October 2019. The price is currently consolidating and the bulls might push the price to a resistance level at $222.58. Hope should be restored to investors as prices could rally in the next months.

Netflix’s Price Has Been Consolidating

The first half of 2020 started so well for Netflix investors as the price remained bullish. The lockdown must have aided the bull run as many countries were on lockdown, getting on Netflix was one of the ways to maximize the lockdown. Before the lockdown, between January 2018 and January 2020, the price of $NFLX was ranging between $228.51 and $421.60. But in May 2020, a breakout to the upside occurred as price brokeout the then $421.60 resistance level. The highest price level $NFLX reached this year was at $591.89, resulting in major resistance. The resistance level at $591.89 was last reached in July 2015 when $NFLX had a stock split at 7 for 1, as the price moved from $662.25 to $110.69.

A head and shoulder pattern is being formed as price retraces back to $569.19. RSI has indicated at two different times of price being overbought between July and August 2021. A reversal might occur, which might result in a sell-off. $NFLX might lose about 160points from the current price at $569.19. Price is currently maintaining the upper region of the Bollinger bands. This year’s support stands at $479.57. As sell-off begins to occur, the year’s gain might be wiped out, as the price might reverse to $409.96.