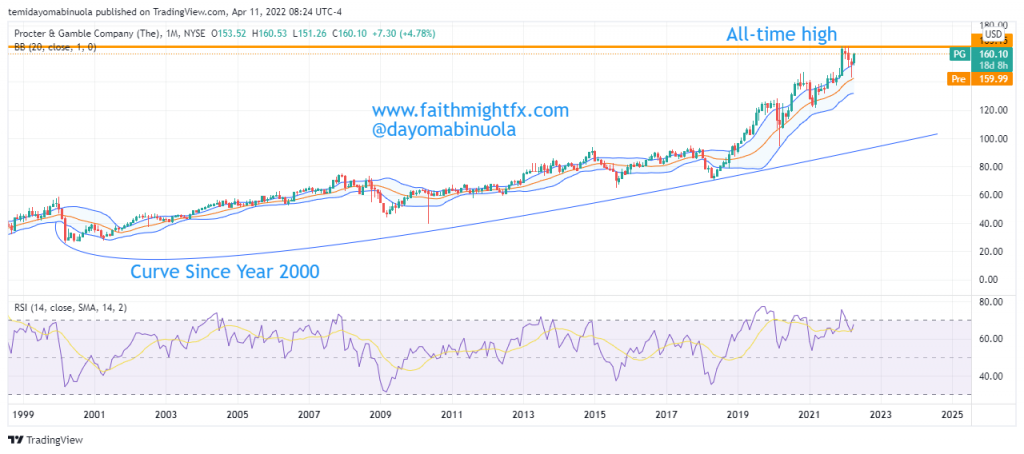
The consumer goods giant has been listed on the NYSE for over 40 years and has accrued huge gains over the decades. Looking at the monthly charts since the IPO, there have been several higher lows and higher highs which is a fundamental characteristic of a bull market. Analyzing the monthly chart, there have never been indications on the RSI that the price has been oversold.

Generically speaking, fast-moving consumer goods are low-cost and often affordable which typically makes FMCG companies record-high revenues. Also, consumer goods are products that the population “consumes” and uses up very fast hence the name “fast-moving”. This makes consumer goods sell very quickly and inevitably increases the revenue made by the FMCG companies. Since 1978, the world’s population has increased by over 3 billion people. This data corroborates the success of FMCG firms particularly a firm like P&G which has been in the industry for decades and is considered a global leader in the FMCG industry.
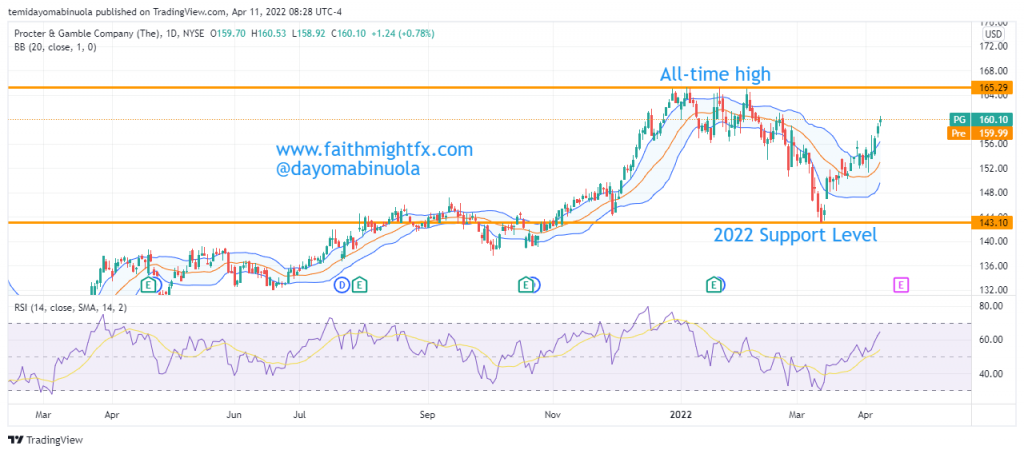
Like other stocks, $PG experienced a fall in 2020 as the price moved from the pre-Covid price of $128 to $94 during the lockdown. Post-Covid price was able to rise to a new all-time high in December 2021 at $164. But then, it rose again to another new all-time high at $165 in January 2022. After this all-time high in January 2022, the price fell to $142 in March 2022 which currently serves as the year’s support.

Price has been able to bounce from the support to the current price at $160. This rally is expected to continue and the price could break out of the current resistance level at $165 which will invariably lead to a new all-time high.
Some of these ideas are in our clients’ portfolios. To understand if this one can work for you or for help to invest your own wealth, talk to our advisors at FM Capital Group. Would you like more information on how to get stocks in your portfolio? Schedule a meeting with us here.
