fbpx

SPX Continues To Hit New Highs

After 67 years of the being founded, the S&P 500 continues to hit new highs. The S&P 500 Index, also known as the Standard & Poor’s 500 or the US500, is an American stock market index that tracks the performance of the top 500 companies listed on the Nasdaq Stock Market or the New York Stock Exchange. It is a free-floating index covering US firms with the largest market capitalisation and book value, representing approximately 80 per cent of the total value of the country’s equity market.
As of December 31, 2023, the market cap was SPX was US$42.0 trillion. As of June 28, 2024, the nine largest companies on the list of S&P 500 companies accounted for 35.8% of the market capitalization of the index and were, in order of highest to lowest weighting.

Some of the largest companies included in the S&P 500 Index today are Microsoft, Nvidia, Apple, Amazon.com, Meta Platforms, Alphabet and Berkshire Hathaway.
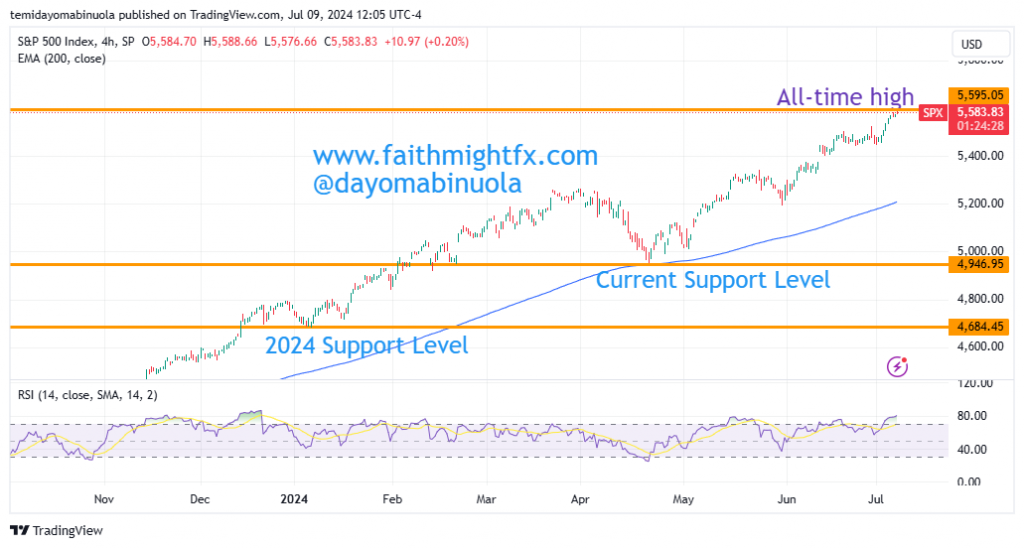
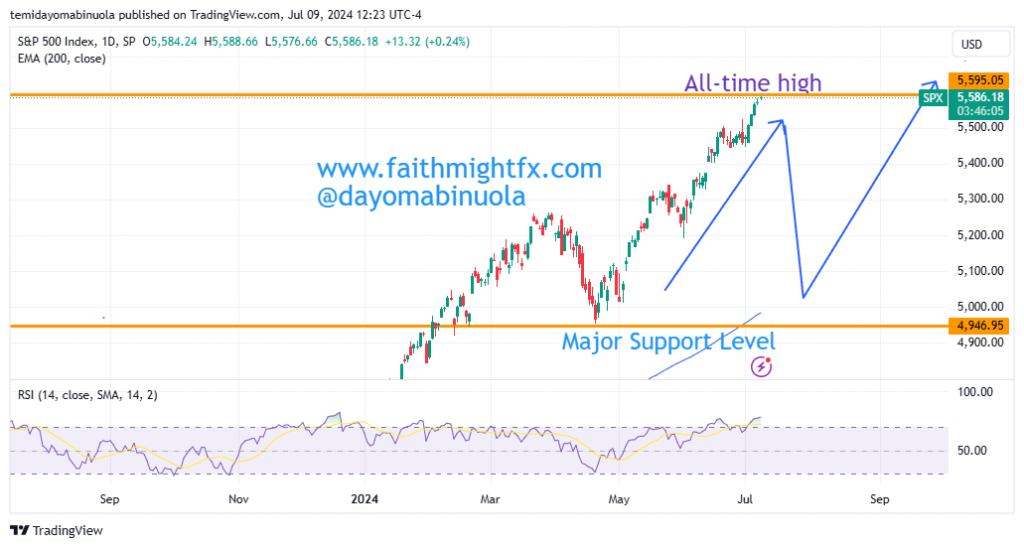
The opening price of SPX this year was $4744. Each month of this year, the SPX index has been reaching new highs. Today, a new high was reached at $5,588. There are two instances on the weekly chart using the RSI that price had been overbought. A correction in price should have occurred but the bulls are very much active with the rally. A reversal in price might occur as price might hit $4988 in the coming weeks.

Some of these ideas are in our clients’ portfolios. To understand if this one can work for you or for help to invest your own wealth, talk to our advisors at FM Capital Group. Would you like more information on how to get stock index in your portfolio? Schedule a meeting with us here

S&P500 Bounces After The January Dump

A huge selloff has occurred in the price of $SPX since the beginning of this year after the market opened on the first trading day of the year at $4784.65. On the second trading day which was on the 4th of January, the price reached a new all-time high at $4817.87. The bearish confirmation was on the year’s third trading day after $SPX lost over 80 points in a day.  The month of January was bearish for $SPX after its loss of over 260points, which was almost a 6% loss from the year’s opening price of $4776.61. Just like the American market, the European and the Chinese markets had a poor January as the market was majorly bearish. In January, $SPX had the worst month since March 2020. Our analysts forecasted the price drop of $SPX in one of our articles in January 2022.

4hr Chart

The sell-off in January was due to the Fed signaling its readiness to tighten monetary policy, including raising interest rates multiple times this year to tame inflation that has shot up to the highest level in almost 40years. The $SPX has been a bull market over the decades. The sell-off in January was a normal correction expected in a bull market. The correction of $SPX made the price hit the lowest price in January at $4221.07. A bounce from the dip occurred in the last week of January as a Doji was formed, which could lead to the beginning of price recovery. The bulls are beginning to gather momentum as the price closed at $4505.15, about 7% price appreciation from the January low. As the bulls begin to become more active, the price could reach $4805.68 in the coming weeks. Price has currently crossed to the upper region of the Bollinger bands on the 4hr chart. 

Weekly Chart

In the 12 months of 2021, $SPX had a new all-time high in each of them. $SPX has continued with a new all-time high in January before the dump. Will a new all-time be reached in February?

Some of these ideas are in our clients’ portfolios. To understand if this one can work for you or for help to invest your own wealth, talk to our advisors at FM Capital Group. Would you like more information on how to get venture capital in your portfolio? Schedule a meeting with us here.