After 6 years of Square being listed on the stock exchange, the CEO Jack Dorsey, who owns 24.4% of the company, changes its name to Block. The main reason for changing the name is for expansion as the company intends to focus on new technologies such as blockchain. Before now, Square was known for digital payments with a focus on point-of-sale terminals and auxiliary equipment to process debit cards. Since its IPO in 2015 at $9, the share price has done 31X as it reached an all-time high in August 2021 at $289.05.

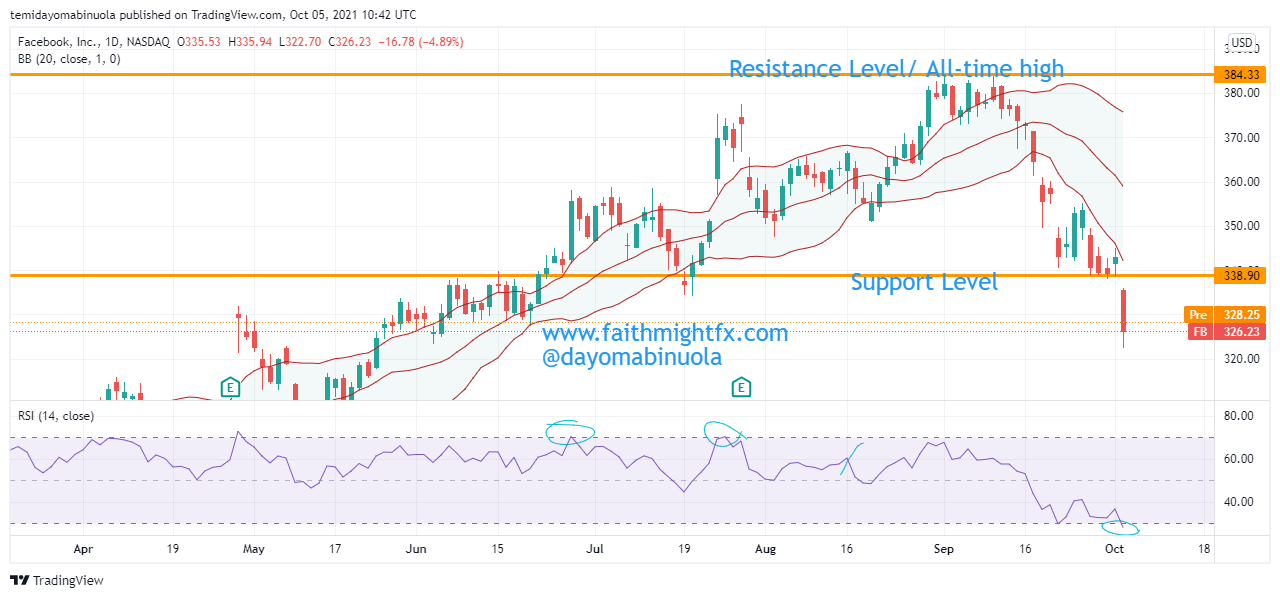
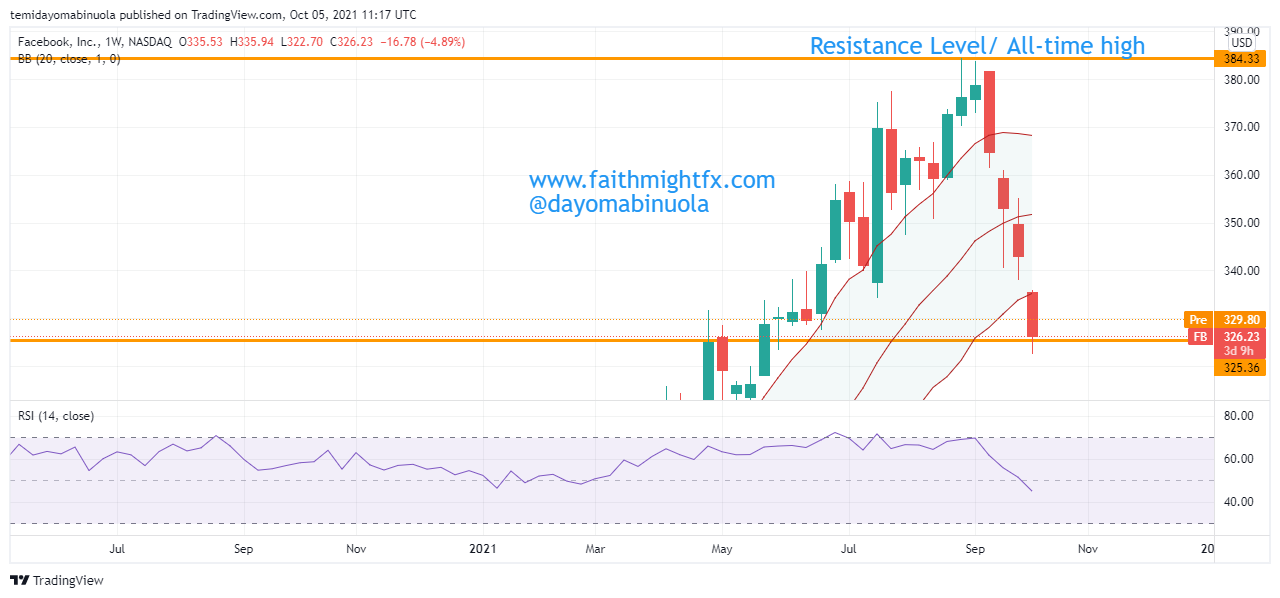
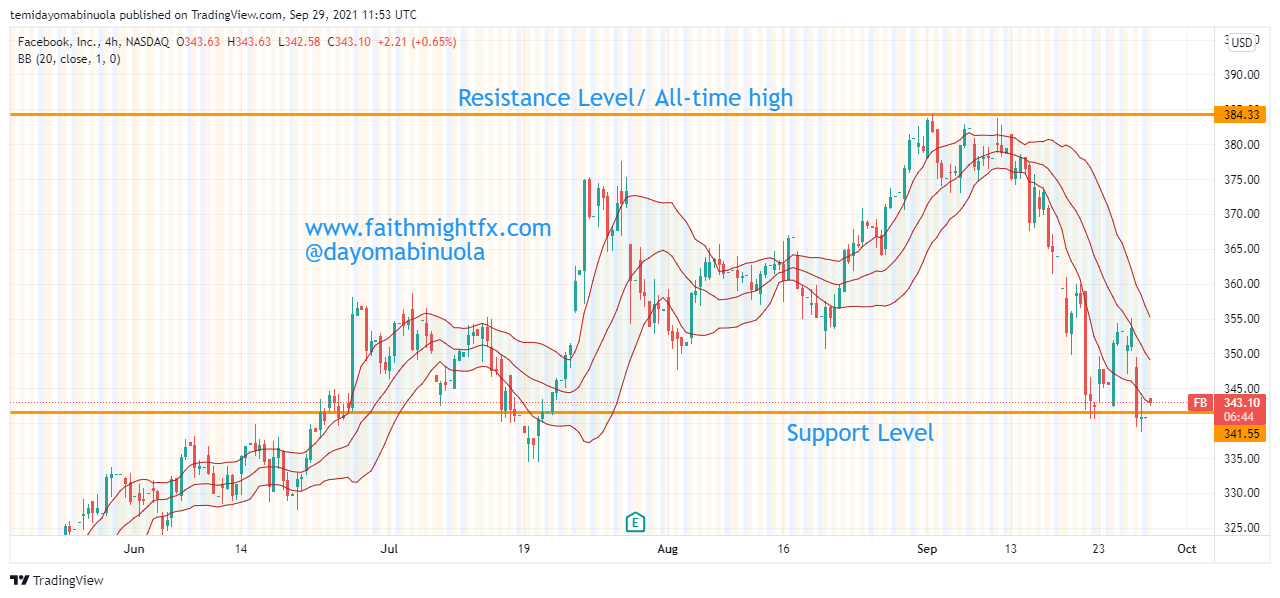
The lowest price of $SQ during the lockdown was $38.02. As the lockdown eased up, price appreciated above $200 before the end of last year. The price movement of $SQ in the last 11 months has been between $192.15 and $289.05. The range in the weekly and monthly chart has been broken to the downside this week as the price reached $185.72. $SQ is currently not showing an indication of a price reversal to the upside. Since the day Square has been changed to Block, the price of $SQ has gone south.

Some of these ideas are in our clients’ portfolios. To understand which ones can work for you or for help to invest for your own wealth, talk to our advisors at FM Capital Group. Would you like more information on Investment Advisory, Portfolio Services, and VC? Schedule a meeting with us here.