The $GBPAUD breakout has been epic. It was one of those amazing rides that you only participate in in portions. There is not a trader who captured every single pip of this move. There are many who did, however, rake in a killing take portions of this gigantic trend wave that broke out to new 2-year highs.
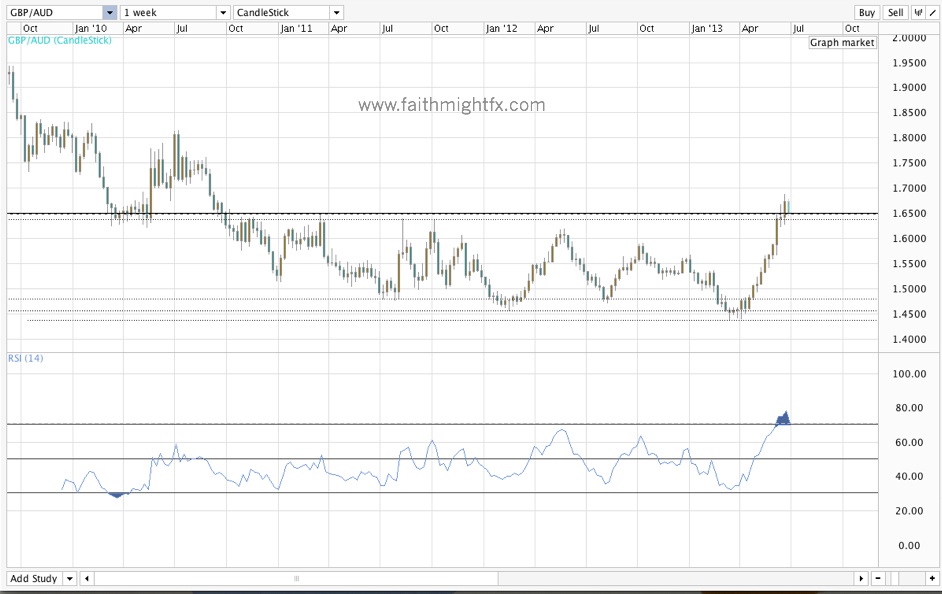
Looking at the weekly chart, it is interesting to note that this is only a 1st bullish wave. Now after 10 bullish weeks, we are starting to see a pullback. The RSI is severely overbought and has been for several weeks now. So a top was not only inevitable, it was necessary.
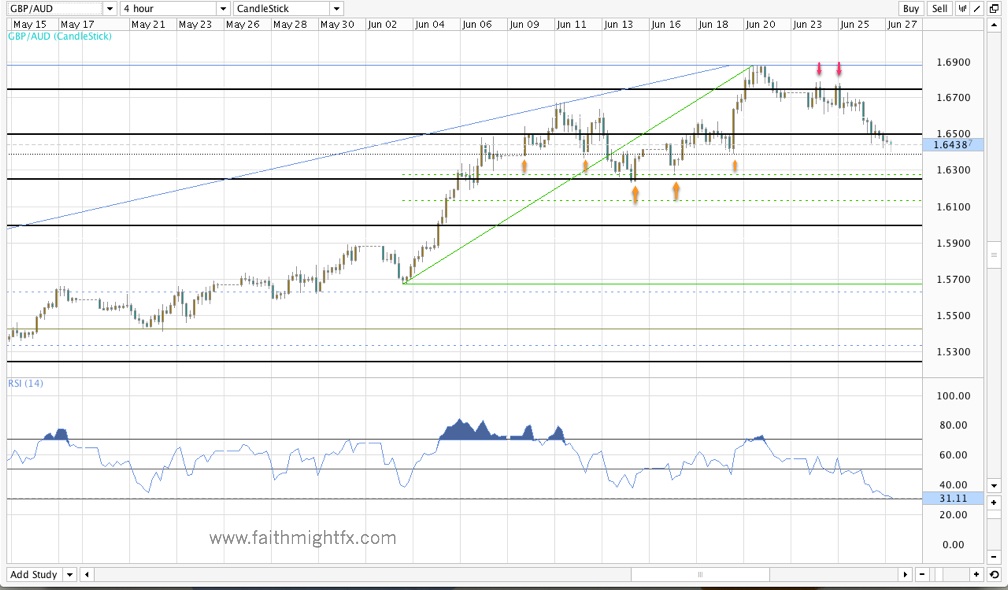
Watch 1.6380 today. Price has bounced from this support level before. If we can get below 1.6380, then price will move toward 1.6270, the 50% Fibonacci level of June’s rally and previous support. From there, price will confirm this new AUD bear trend or allow for a deeper correction still.