
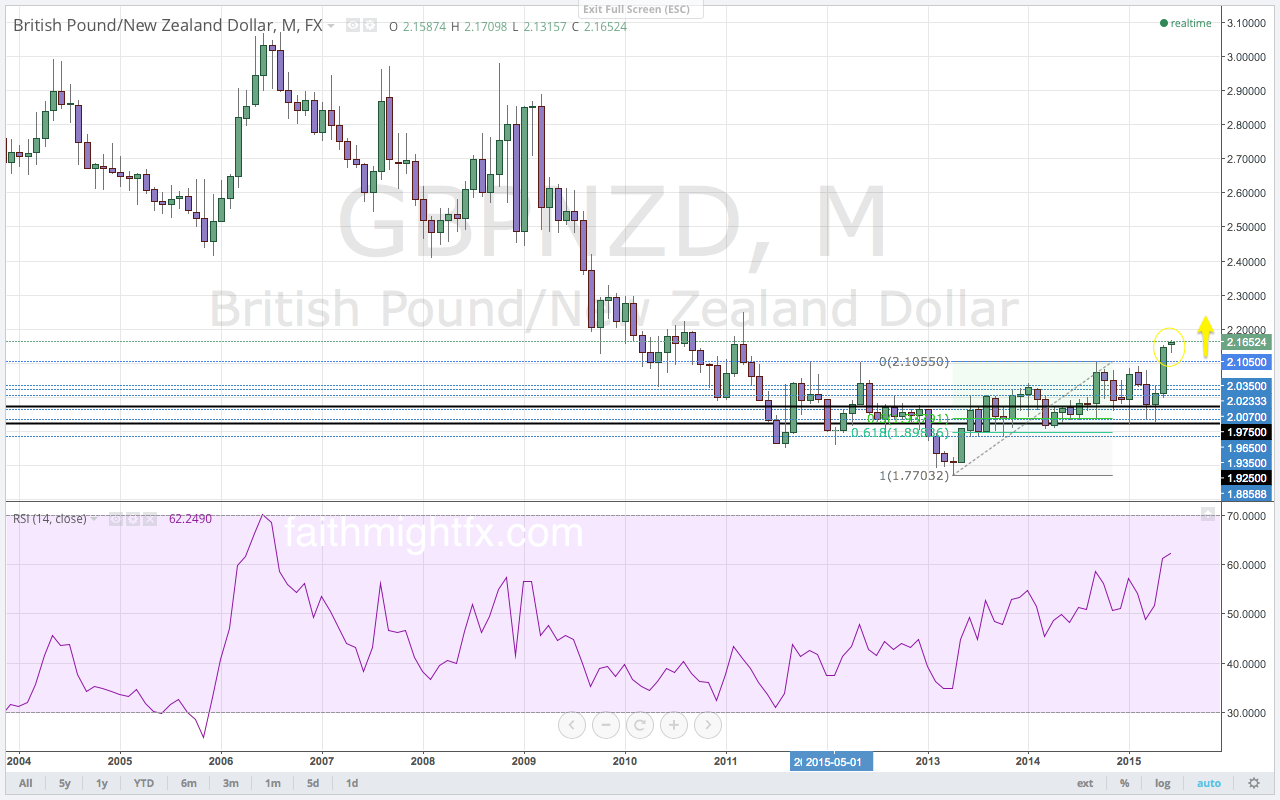
The $GBPNZD continued its move higher last week by extending the rally to new highs at 2.1709. Since the breakout rally took out the former highs on both the daily and weekly charts, we must look to the monthly chart for the potential of a continuation higher. Looking at the monthly chart, the importance of the 2.1050 level is significant for future direction. After finding resistance at the 2.2050 level back in, the $GBPNZD made many attempts to move lower. Soon the $GBPNZD was trading in a huge range between 2.1050 and 1.9250. The past two months found price holding the bottom of that range to breakout above the range top. With a confirmed close above the key 2.1050 level, the $GBPNZD has potential to move higher still. The next major level of resistance is found just above the major 2.2000 psychological level.
While the breakout of last week took price to new highs, momentum, on the other hand, did not follow suit. The RSI shows a bearish divergence on the daily chart at the highs. This divergence has the potential to push price lower into the buy zone marked by the Fibonacci levels of the latest bullish wave. Though the 2.1050 level is a key level for direction, it is the 2.0800 level that must hold as support for the $GBPNZD to maintain its bullish bias.
This is an excerpt from this week’s issue of Quid Report. Subscribers receive my research on all major GBP pairs at the beginning of the week, including access to @faithmightfx on Twitter for daily, real-time updates to the weekly report. AVAILABLE NOW.