
Each week, I highlight a chart out of the Quid Report.
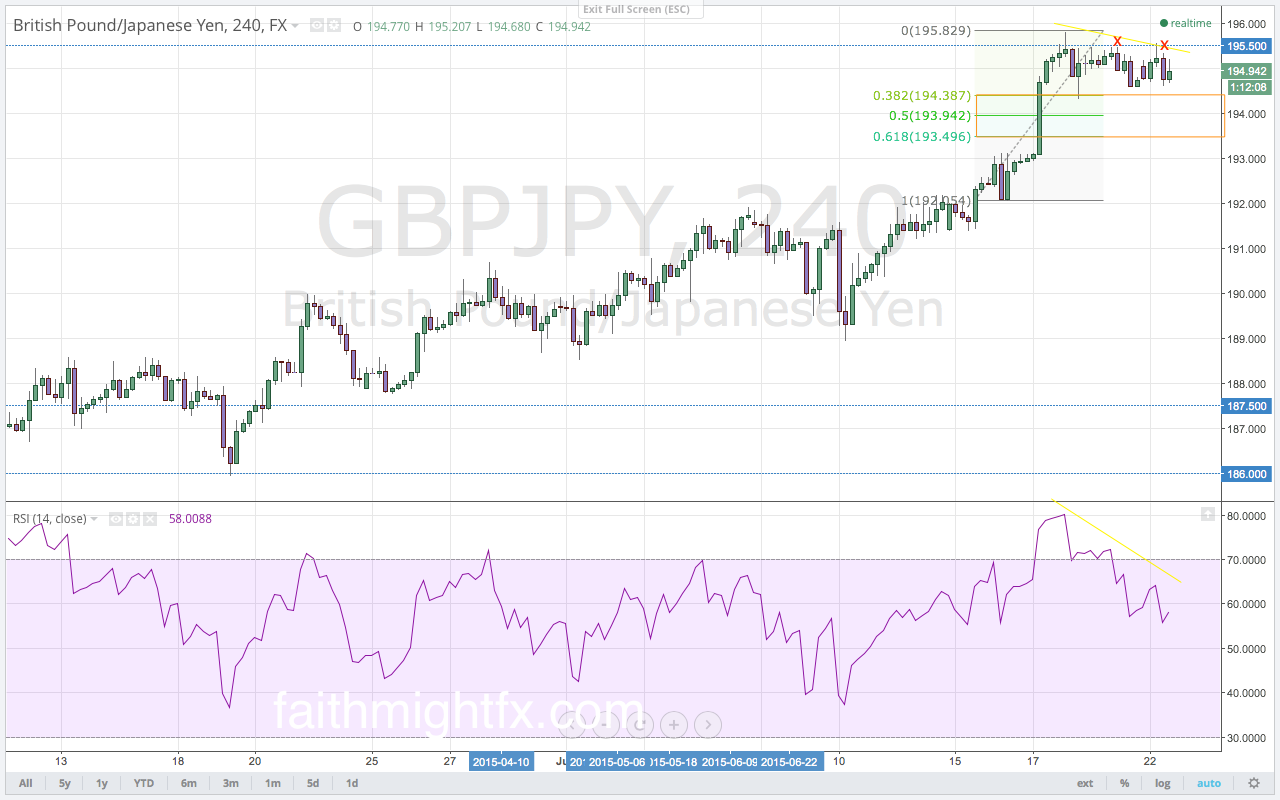
The $GBPJPY failed above the 195.50 resistance level all week. Now that $GBPJPY has moved lower off these highs this week, is it now ready to break higher?
This is an excerpt from this week’s issue of Quid Report. Subscribers receive my research on all major GBP pairs at the beginning of the week, including access to @faithmightfx on Twitter for daily, real-time updates to the weekly report. AVAILABLE NOW.