fbpx

Don’t be Pound Foolish

The new trading week has been very busy out of the UK this week. Inflation may be heating up in both regular pay wages and consumer prices. Perhaps the accelerated weakness in the Great British pound may start to feed inflation as the increasing price of imports may be passed on to consumers. Additionally, the low exchange rate may also forces companies to raise wages to keep up with this rising price of goods and services. The PMI numbers that had trended below the 50.0-threshold level earlier in the year have started to recover. The October releases revealed robust PMI numbers in all sectors of the economy. It will be interesting if this recovery in the PMI numbers this month will persist. If so, building strength may allow the Great British pound downtrend to finally correct in the short-term. Any strength in sterling, however, is expected to be temporary.

After weeks of decline and new, multi-year lows, the Great British pound has staged a correction. Depending on your chart, it has been impressive and not so impressive all at the same time. But it has been a correction nonetheless. And it has allowed swing traders to reset short positions as currency pairs like the $GBPNZD and $GBPUSD trade at essentially all-time, low levels.

GBPNZD DAILY CHART

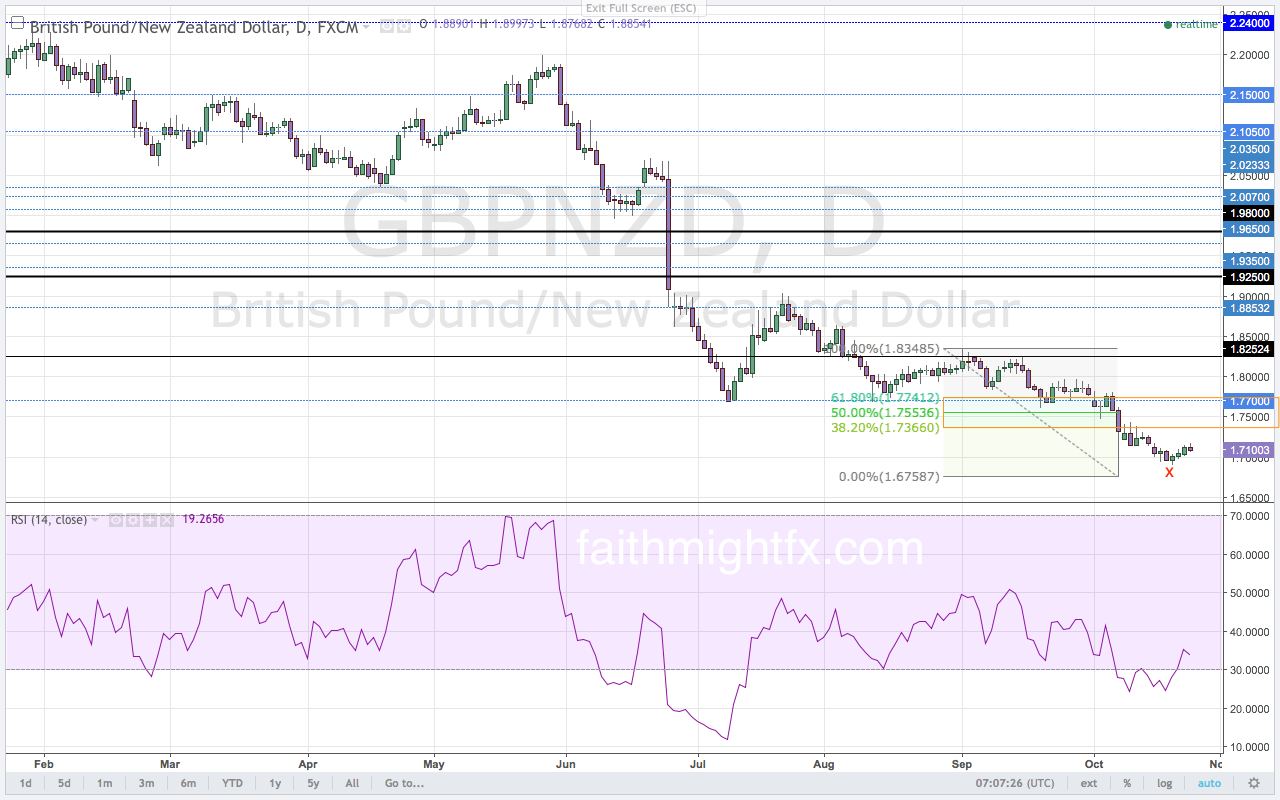
This Friday close is the third consecutive weekly close below the major 1.7702-support level. This is the first time there have been consecutive bearish closes below the 1.7702-level on any timeframe (Volume 79). However, with building bullish momentum on the RSI of the daily chart, the $GBPNZD may stage a correction off the lows. The failed low of last week also signals a bullish move higher.

The highs this week have not been able to get quite as high at the Fibonacci levels. And that failure is actually evidence of the strong bear trend in the $GBPNZD.

GBPUSD DAILY CHART

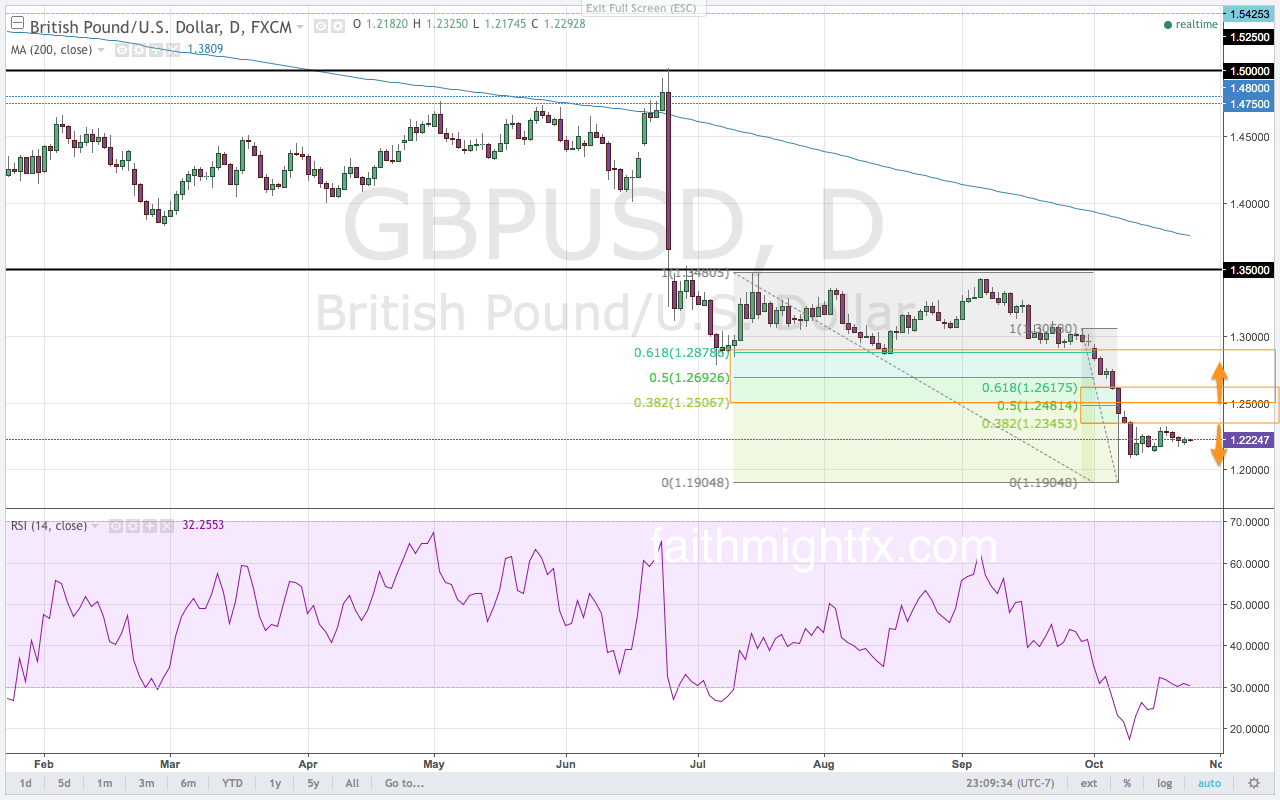
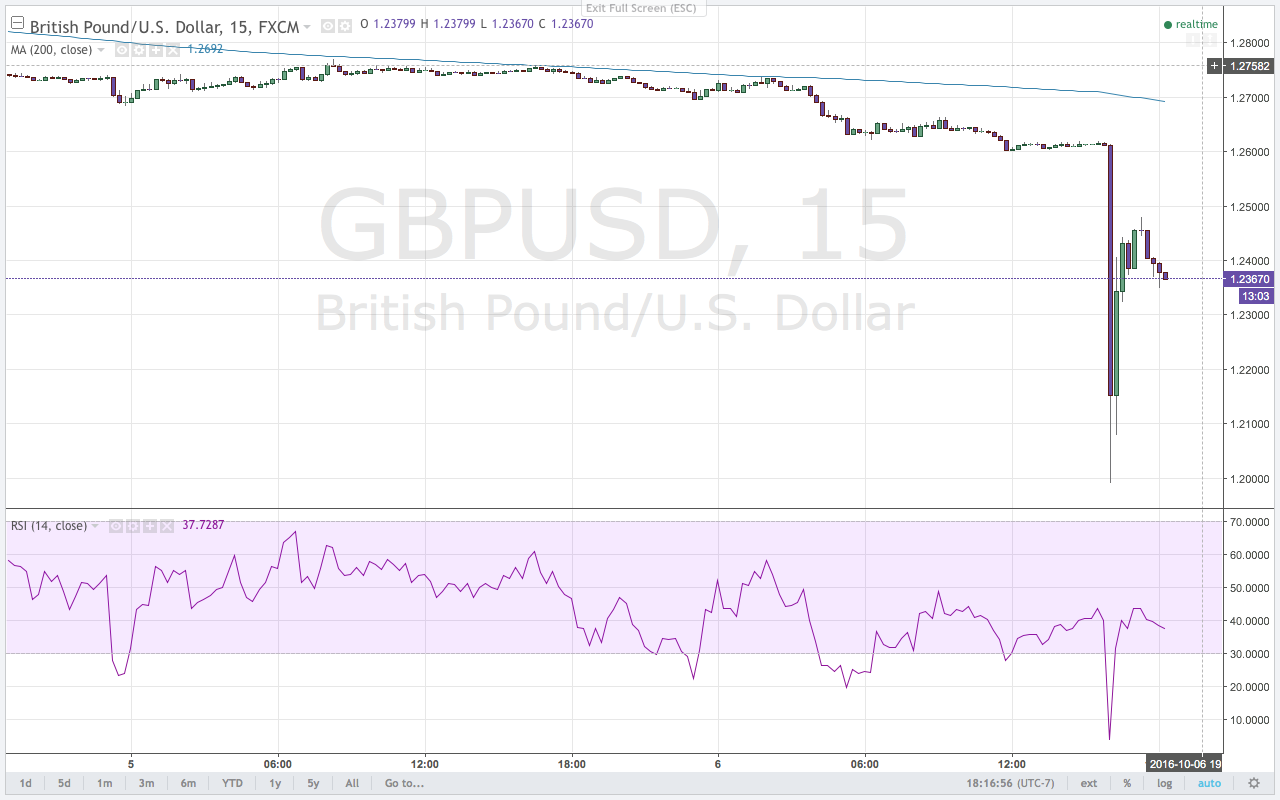
The $GBPUSD currently trades at levels not seen since 1985. As such, there is very little technical support at these price levels. However, the $GBPUSD has started to forge out minor support at the 1.2160, 1.2154 and 1.2132 levels. This support zone seems to have stalled selling in cable for the time being. Without a close below the 1.2000-psychological level, the $GBPUSD begins to build bullish sentiment in the very short-term.

Cable has been coiling between the 1.2350 and 1.2100 levels since the flash crash. While the defense of those 1.2089 lows this week emboldened bulls, it has not been enough to spark a rally to the psychological level at 1.2500. This failure keeps the $GBPUSD bearish despite the rally off the new lows this week.

All in all, sellers continue to show up at the highs. The rally has totally underwhelmed. Only against the JPY has the correction moved as high as expected. While there could be an argument that Brexit woes and implications are already priced into the market, price action seems to indicate otherwise. With these currency pairs trading at these low levels, the GBP has the certain potential to move lower still…until it doesn’t. Be careful out there. Don’t chase the price action!

All quotes and charts taken from this week’s Quid Report, Volume 82. Full report has trade setups and includes more currency pairs.

Patience Required

The S&P 500 ($SPX) is the U.S. equity index that I use to watch and gauge strength or weakness in the US stock markets. If we concentrate on just this year’s price action, the $SPX has put in a very impressive rally off the February lows. It is impressive for 2 reasons: 1) The lows were actually at a healthy Fibonacci retracement level of the monster rally in U.S. equities that occurred between 2013-2015; and 2) The rally has had 2 healthy corrections this year that have been largely supportive of the move to new highs at the 123% Fibonacci extension target of the 2013-2015 rally after the market fell in February.

But there has been something glaringly wrong with this rally even as it reached new highs. The momentum in this rally has not been supportive. As price moved higher, buying momentum was waning. A rally needs more, not less, buying momentum if it is to continue even higher. That is not what has been happening this year.

S&P 500 daily chart

That lack of buying strength manifested finally when the market moved lower last month in September. After this decline, the market then moved in a choppy, sideways grind for 3 weeks. There just hasn’t been a move to take advantage of in either direction with indecision from both buyers and sellers. These failed highs signal a move below the 2120-level. It took almost a month but this anticipated move lower finally got started yesterday when the $SPX broke support around the 2140-level.

S&P 500 4 hour chart

So, as anyone can observe, it has been a tough market to buy since making the new, all-time highs in August. If the market continues to move lower, the news media will start to get louder with pessimism and bad news. Be forewarned and understand that that will be the precise time to shut off the TV and revisit your investment plan. Because even after the 2008 financial crisis, there was a buying opportunity. And what a buy it was. Don’t get scared of the next financial crash. Get ready.

S&P 500 MONTHLY CHART


I Survived the Flash Crash

The GBP just crashed in epic proportions. The official number is -5% in 2 minutes and 3 seconds.

GBPUSD 15 MINUTE CHART

It is already being called a flash crash because of the sheer scale of it. And the craziest thing about it is that we were on the right side of it. The following quote is from this week’s Quid Report (Volume 79):

The follow-through lower already this week proves correct the assertion in Volume 76 – that the resumption of the long-term downtrend that is the Great British pound has indeed taken place…It is very likely that this bear trend is the direction sterling trades for the remainder of the calendar year.

The rest of the report this week goes on to outline the setups that took place at the beginning of this week. Most of the targets had been hit before the flash crash except for two trades. These positions are up HUGE.  I haven’t seen this much money on a single trade in a long time.

I SURVIVED THE FLASH CRASH….

So I immediately issued a tweet to all Quid Report readers. This is not verbatim but it was definitely to this effect:

keep calm and carry on

If you were short the GBP ahead of this flash crash – GOOD FOR YOU! KUDOS! How you manage this trade is up to you. But no one will blame you if you close out these positions for all this big money. Taking big profits is the name of the game!

Image credit

The Noisy Twitter Bird

Twitter has been making a lot of noise in the news since last week. The media caught wind that Twitter was entertaining buyout offers. This is not the first time we have heard of a possible Twitter acquisition. Last year, it was reported that Twitter buyout rumors at that time were actually fake. The stock price jumped back then too.

Nevertheless, I am bullish Twitter because I use it. I know the power of Twitter. It would not be possible to democratize finance without the birth and widespread use of Twitter in our business. It can been a better compliant tool than FINRA could’ve ever hoped. Too bad they don’t see that way and don’t know how to use it. And that is Twitter’s exact problem to begin with. Regular folks just don’t know how to use. I think it is largely because not enough employees use Twitter themselves so how can ever fully appreciate the inherent power that is Twitter? Let alone, teach others like them who don’t understand how to use it.

Twitter has a usability issue not a value issue. And until that wrong is righted, the stock price will continue to disappoint.

TWITTER DAILY CHART TWITTER WEEKLY CHART

Twitter, therefore, remains a very long-term investment. The stock has only been trading for 4 years so trying to determine where price is headed is really anyone’s guess. However, the charts are pointing to another move to the downside. And such a move targets the $15.70 lows or the $13.70 lows, depending on your timeframe. A close above $25 invalidates the bearish sentiment.

So the question you have to ask yourself is whether early investors are willing to hold stock at this current $20.00 price level? Earlier investors have been selling $TWTR stock as recently as 10 months ago. Ask yourself another question – the more important question: What kind of investor are you? That will dictate what you do here.