
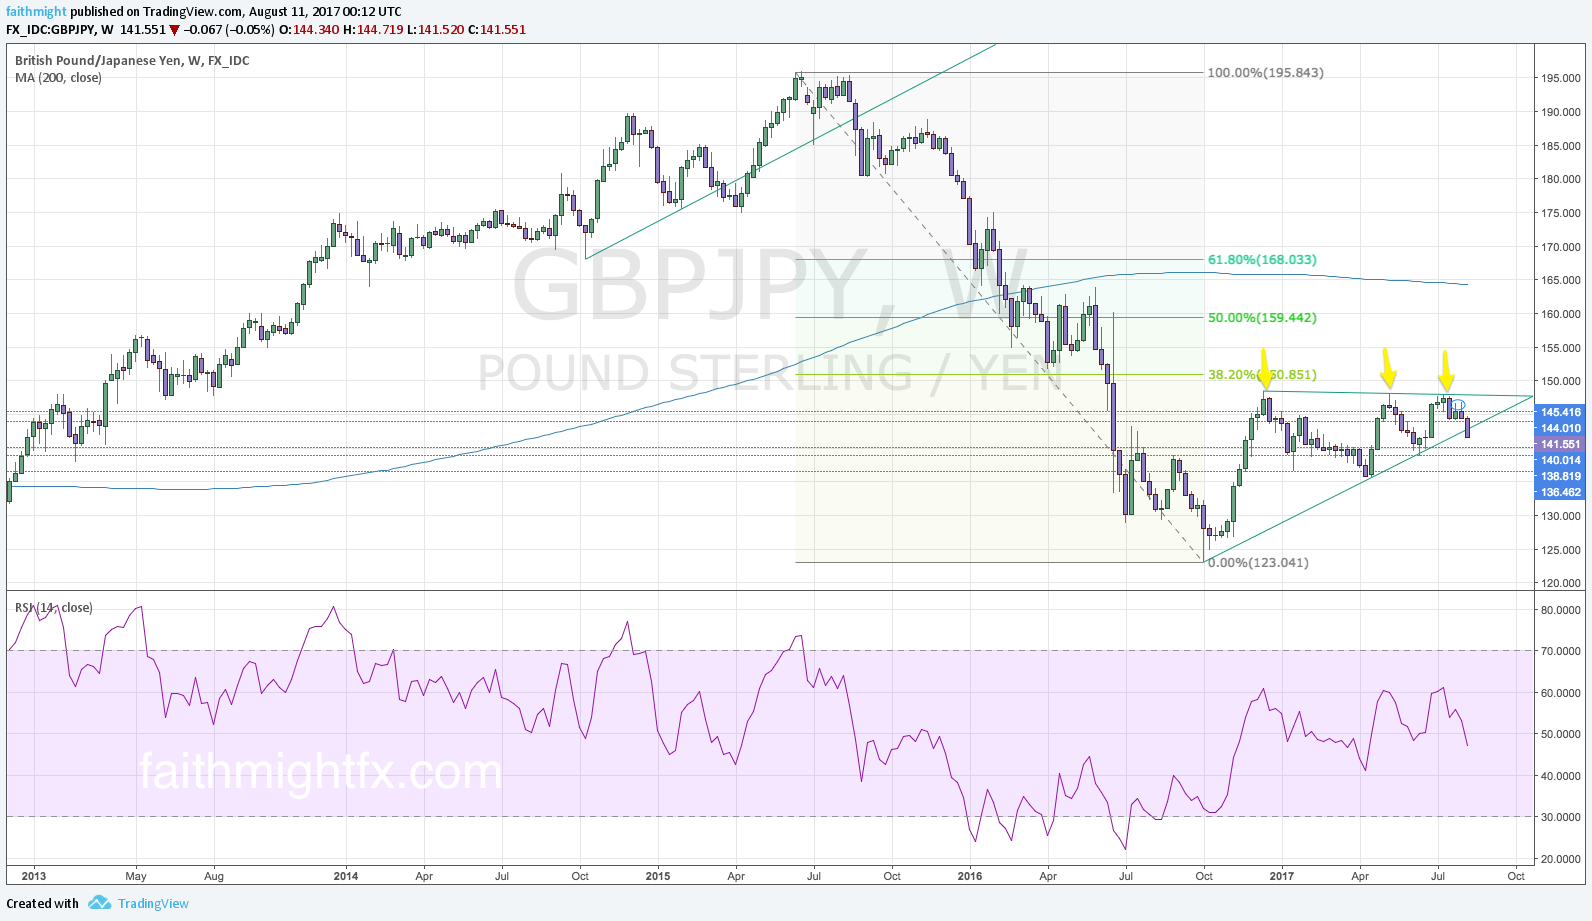
The $GBPJPY has a huge wedge on the weekly chart but it has been difficult to catch a move on this currency pair. Shorts at the top of the wedge just above 147.00 level had to contend with choppy price action. After a few weeks price finally broke down lower to the 144.00 support, and former resistance, level. The reason why I don’t think we’ve seen a huge correction is because we have been moving in such a way that allows momentum measured by the RSI to reset. With the measured move lower to the 144.00 support level. When the yen caught any kind of weakness, the $GBPJPY moved as high as 146.76, close to the former highs above 147.00 which are the former lows turned now resistance level. However, I think this one will just continue to grind lower. The price action has stair-stepped all the way down allowing momentum to progress naturally lower in the midst of this very measured move to the downside. Until this week.
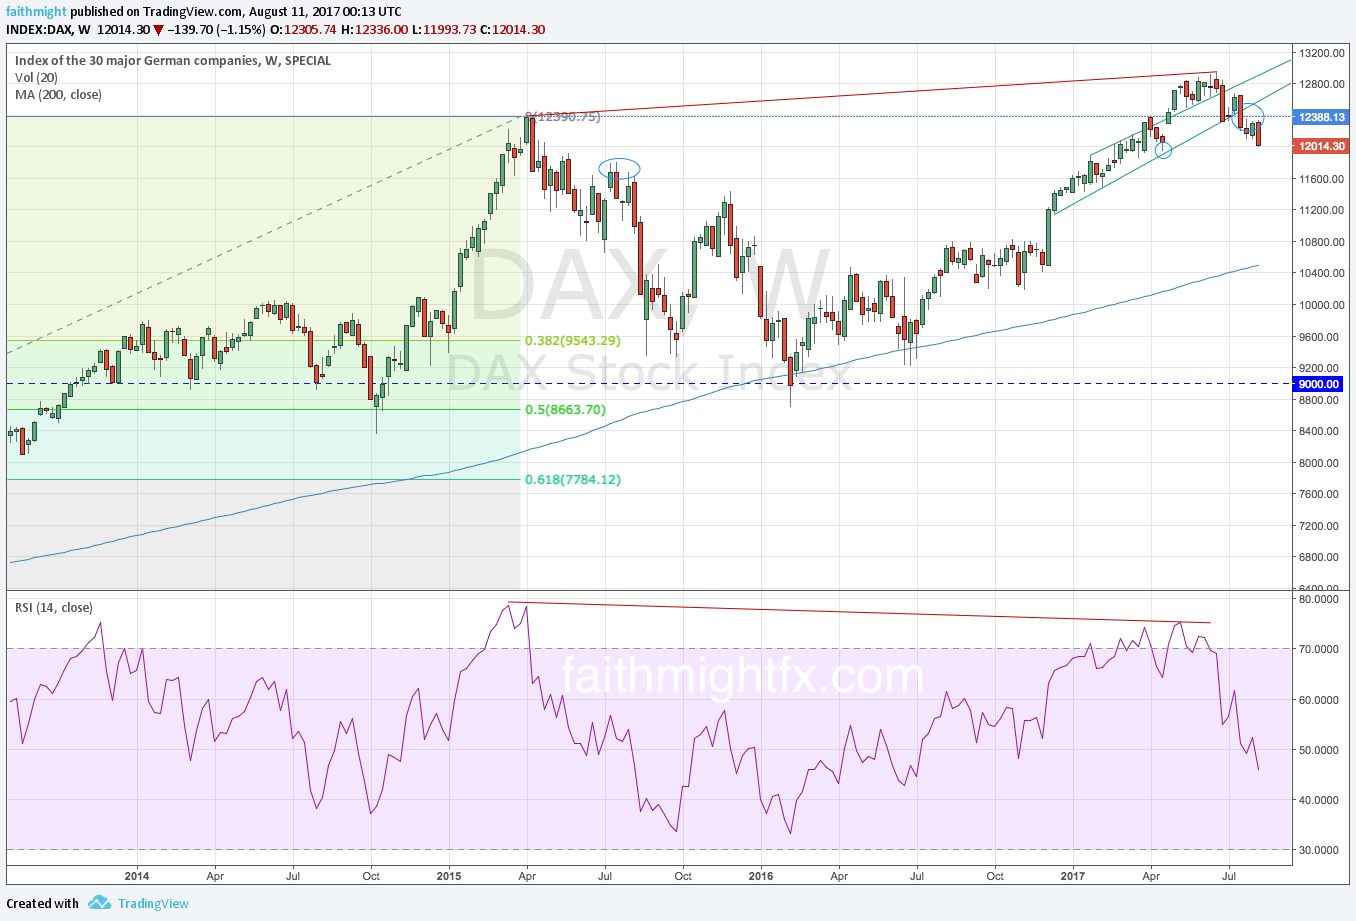
If you look at U.S. equities, the major American stock indices have been making new all-time highs all summer. Equities just keep grinding higher despite the divergence in momentum between price and RSI. The divergence has been recently invalidated with momentum make a new high higher than the previous high. However, the other equity markets in Europe, Great Britain and Japan have all failed to make new highs in tandem with the U.S. markets. In fact, the $DAX has already broken below recent lows and the $NIK has failed to move higher. The weak dollar has clearly supported U.S. equities higher. In converse, the strong euro has been killing European equities as of late. The forex market has certainly been a factor behind the divergence in western stock markets.
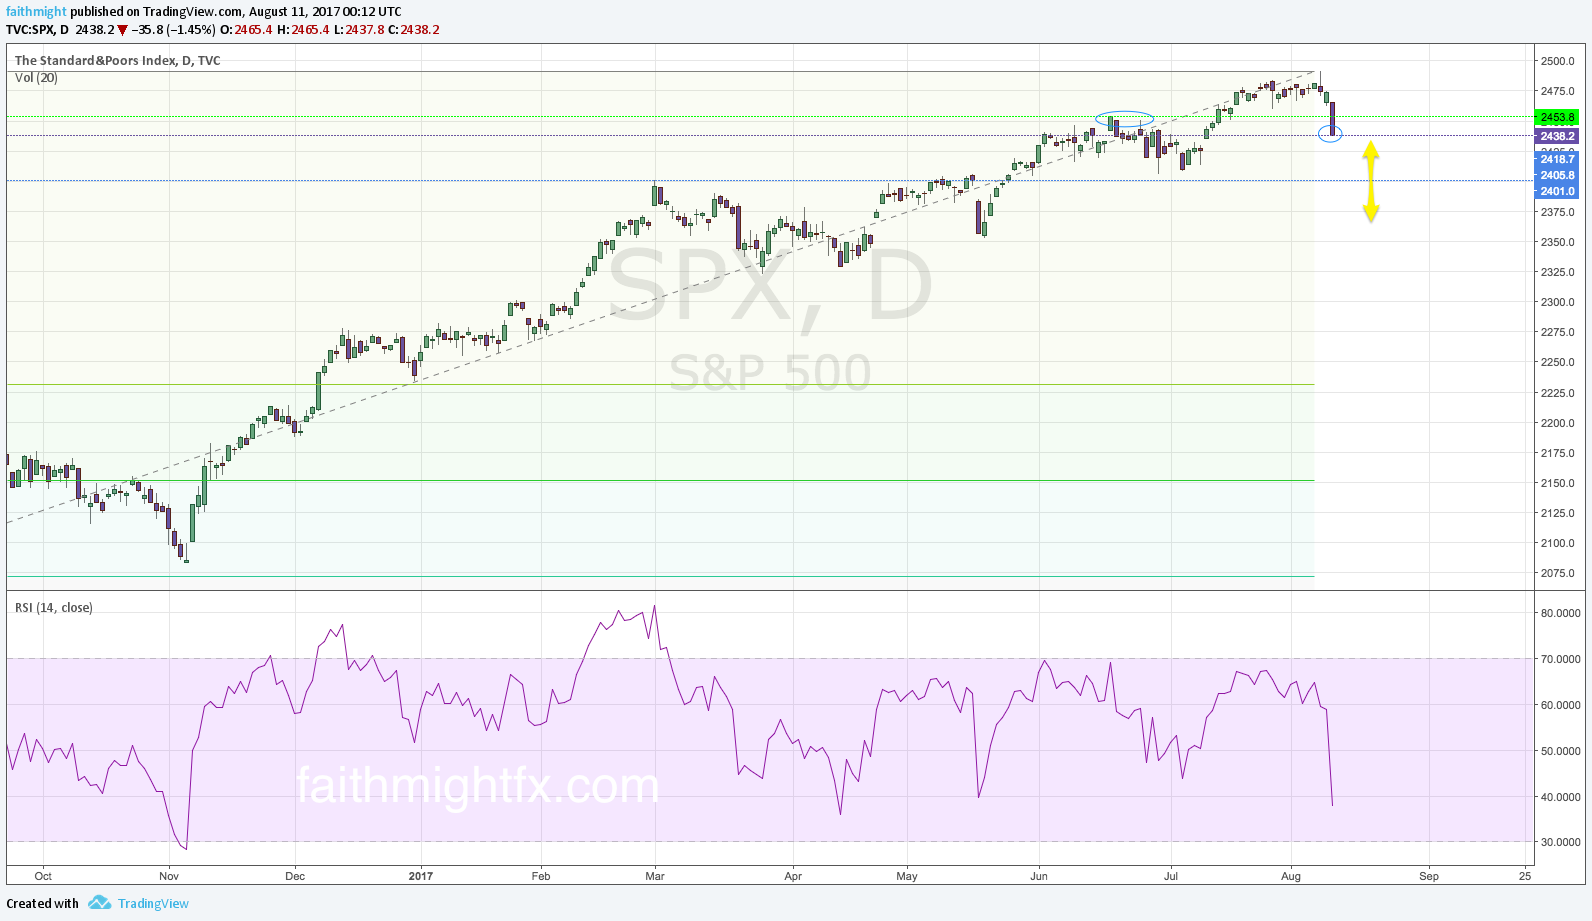
And in steps North Korea. The geopolitical tension between North Korea and the United States has been building for months. But this week, the warring ideologies escalated to fighting words. The market closed today below the summer highs for the first time since trump took office this year. This looks to be a first, early signal that the market is starting to crack. Will it be 2007 all over again a decade later? Get ready.