fbpx

Australian Dollar On Fleek

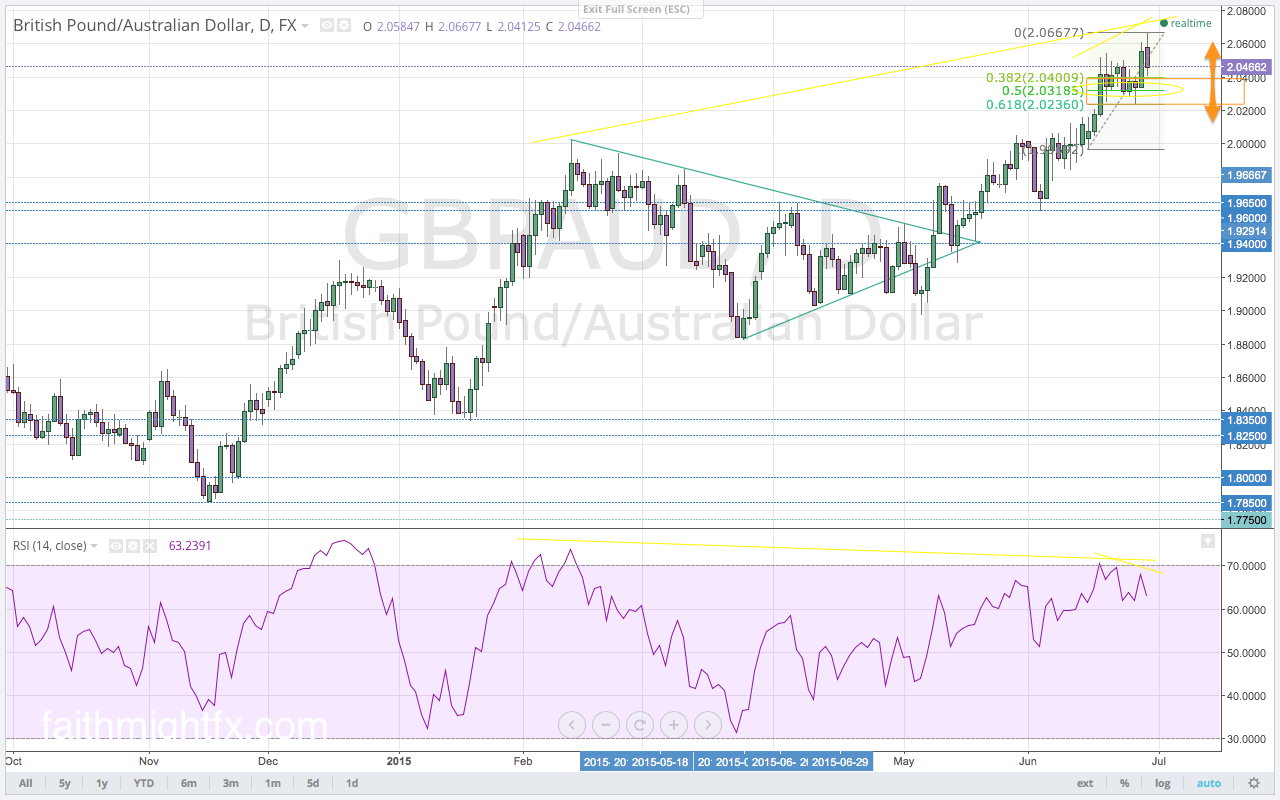
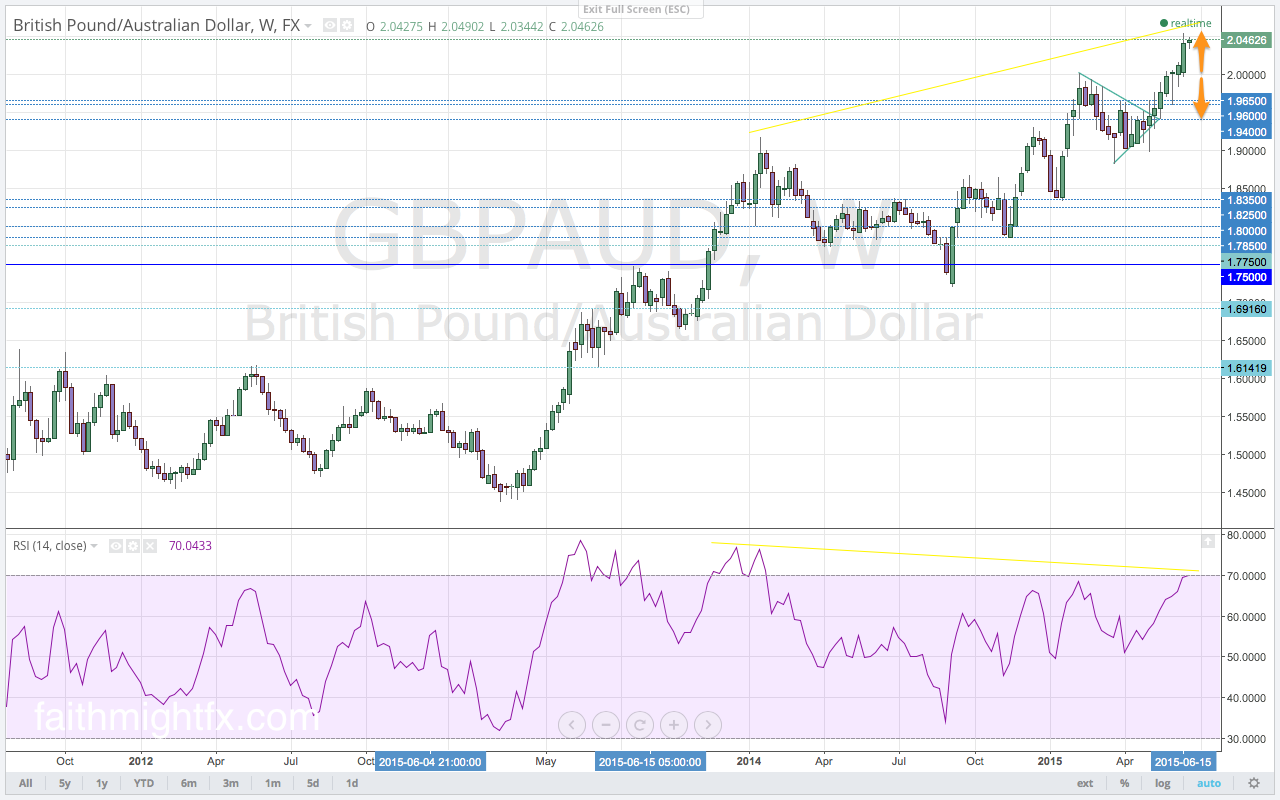
The Australian dollar continues to rip higher with little regard for the Reserve Bank of Australia dovish sentiment. Though the RBA has cut interest rates and will likely cut again in 2017, the market is not blind to the fact that the Australian economy continues to remain robust. The RBA is bullish on the economy too. Australia survived the crash in commodity prices. Now that they are recovering, the GBP/AUD remains biased lower for a continuation of the large Fibonacci move (see Quid Report, Volume 58). The inability of the GBP/AUD to close above the 1.7500-level also signaled bearish price action. While the GBP/AUD now has the room to move lower on a continuation of the bear trend, the bullish divergence remains on the weekly chart. The bullish divergence signaled the rally higher back above the 1.7000-level. The rally this week saw the $GBPAUD move back to the top of the channel.

GBPAUD 1 HOUR CHART

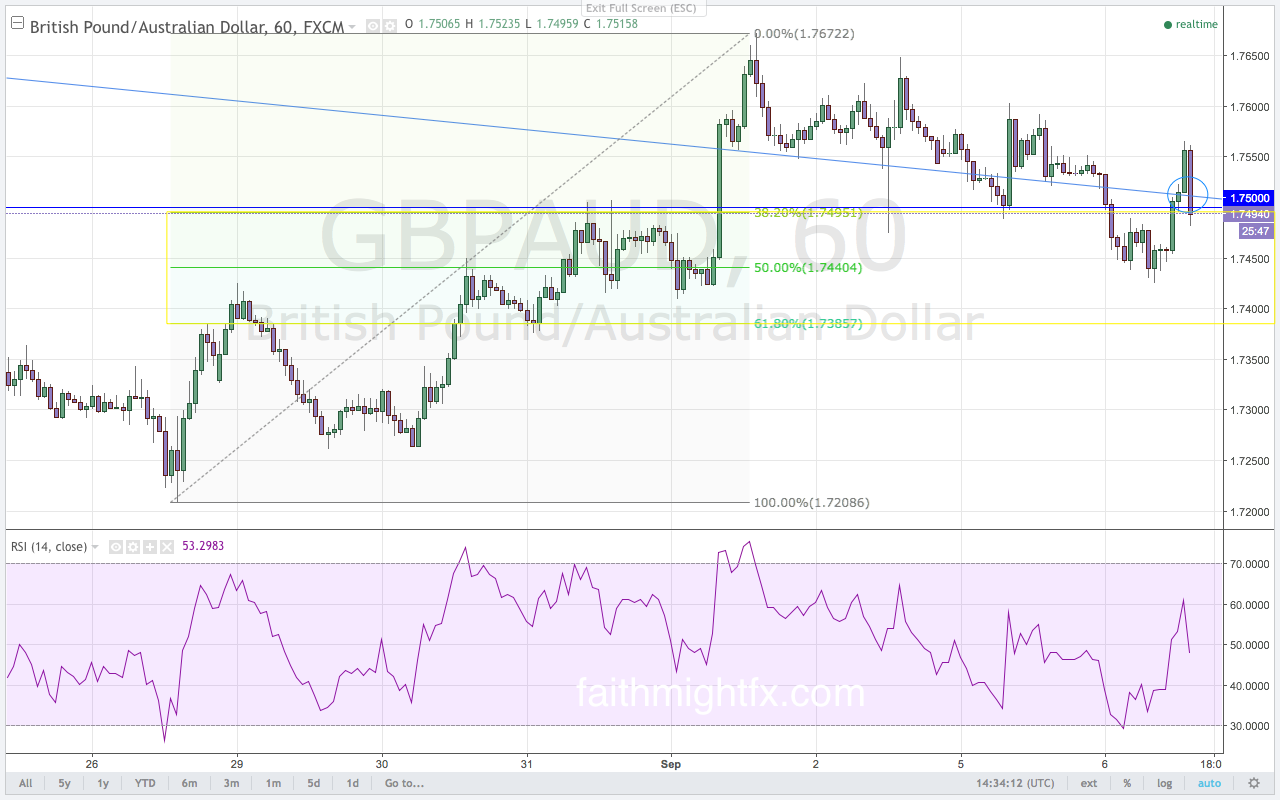
The event risk of the week for the Australian dollar was the RBA interest rate announcement. The RBA did not move on interest rates this week after surprisingly cutting interest rates in August. The $GBPAUD moved slightly higher on Australian dollar weakness after the announcement with no new highs printed. If the lower highs lead to a break of the 61.8% Fibonacci level on the 1-hour chart, this break lower signals a reversal back to the long-term lows at 1.6720. The interim target for sellers, however, is the lows at 1.7208. Only a move back above the trendline invalidate the current bearish bias.

Carry Is An Aussie’s Best Friend

The GBP/AUD found resistance at the 2.0650 highs as sellers stepped in at the upper trendline of the channel two weeks ago. Resistance at the top of the channel continues to confirm the bearish hold below the key 2.1200 level. The GBP/AUD maintains its bearish bias to start this new trading week. Rallies will be met with sellers. When the GBP/AUD did not complete its move to the bottom of the channel, price found support at the major 2.000 support and psychological level and returned to the top of the channel. Resistance at the top of the channel continues to hold and cap rallies. As such, sellers last week were well positioned for a move back to the bottom of the channel below the 2.0000 support level. However, it remains to be seen if the lower trendline continues to hold as support. The interest rate differential is still relatively great compared to the other major currencies with the exception of the New Zealand dollar. The carry trade may be reason enough for the GBP/AUD selloff to continue, especially given the divergence in monetary policy between the BoE and the Reserve Bank of Australia (RBA). The BoE has turned dovish while the RBA remains neutral. The RBA has an increasing concern for rising inflation induced by last year’s weak Australian dollar. The lack of new monetary policy action from both central banks keeps the GBP/AUD in the channel.

GBPAUD 4 HOUR CHART
GBP/AUD breaks the channel bottom as price plunges after the gap down. No big deal. We’ve seen this before.

When the $GBPAUD found resistance at the channel bottom after breaking below it, that was the first time in 6 months price has ever behaved this way outside of the channel.

Premium trade setups with targets and stops are published in the GBP/AUD Outlook in Volume 51, this week’s Quid Report.

QUID REPORT LIVE

Due to the holiday shortened week and it being the very last week of 2015, no Quid Report was published this week. Instead, I am doing a video update to last week’s written report. While I have been on many forex shows, this is my first time hosting a live broadcast. This should be a quick update and review for the week in progress. Enjoy! And please leave your feedback in the comments. Perhaps this will be a new thing for me in 2016.

Australian Dollar Defies Commodities

The Australian dollar found strength when the Reserve Bank of Australia (RBA) monetary policy minutes confirmed that the central bank would not move on monetary policy again this year. Though the RBA believes that monetary policy needs to remain accommodative, markets have reacted positively to the decision to leave monetary policy as is. The $GBPAUD has since moved in a down channel on the back of Australian dollar strength. Last week, the weakness in commodities finally caught up with the Australian dollar. The Australian dollar finally weakened in the face of extended new, multi-year lows in commodities. After moving to the bottom of the channel, the $GBPAUD respected support at the lower trendline of the channel. Price rallied higher on the back of the weak Australian dollar. A rally in the $GBPAUD was expected to rally back to the trendline at the top of the down channel. Given the velocity of the moves in commodities, the $GBPAUD managed to return to the top of the channel in just one week of trading. While the $GBPAUD was met with profit-taking just ahead of the key 2.1200 resistance level, the new trading week opened with a move above resistance to 2.1216. However, sellers stepped in at the highs ultimately respecting the upper trendline resistance and moving price back to the key 2.0800 support level.

GBPAUD DAILY CHART

The top of the channel here has confluence with the key 2.1200 resistance level. For the $GBPAUD to continue to rally, the $GBPAUD needs a confirmed close above the 2.1200 level. Ahead of the channel bottom is first the major 2.0800, now turned, support level. There is also confluence with that support level at the 50% Fibonacci level of last week’s rally. The 2.0800 level remains the key level for direction. With no confirmation on the break above the 2.1200 level, the $GBPAUD actually opens the new trading week bearish even with a Friday close at the highs. The $GBPAUD continues to trade in this channel. As such, after reaching the top of the channel, the $GBPAUD is biased bearish based on the technical developments in price action. Price has already moved to 2.0818 finding support just above the 2.0800 support level. With commodities crashing again as they did this time last year, the Australian dollar should experience another tremendous selloff. However, $GBPAUD price action suggests further Australian dollar strength in the face of weak commodities.

Premium trade setups with targets and stops are published in the $GBPAUD Outlook for the Week (Volume 42, this week’s Quid Report).

Is This The Bottom?

Last week, I was on the air live with Dale Pinkert, host of FXStreet’s Live Analysis Room. My episode is down below. It’s always fun talking GBP with Dale because he always has insights to share with me as I do with him. His experience in futures on top of the forex always leads to a good conversation. The interview never feels like an interview. Just good trading talk between friends.

The interview took place the day before the September non-farm payrolls dropped. You’ll hear us talk equities quite a bit. With the weakness in the $SPX, I explain why the $GBPJPY was actually looking to fall further to 174.86 and possibly even as low as 167.99. But the weakness in the NFP report may change everything. Apparently, Yellen and the $FED did know something we all didn’t know. The recent global malaise in China, Syria and Brazil are, in fact, starting to show ripple effects in the U.S. economy. And if this economic weakness becomes a trend, interest rate hikes out of the Federal Reserve are off the table. Probably completely. Definitely for 2015. The lack of wage growth and the less-than-expected jobs growth has finally convinced markets that the $FED is not moving on interest rates. In fact, whispers of QE4 are back. Expect that drum to beat louder if the U.S. economy starts to show more weakness in the months ahead.

Looking at the $GBPJPY as our equities proxy, the Friday close above the 181.00 support level is a bullish signal in light of the strong close in the S&P 500. Watch here:

CHART OF THE WEEK: RBA WAGS BACK

The $GBPAUD daily chart posted this week is the clear winner.

I like the Reserve Bank of Australia (RBA). They have actually been neutral for weeks. It’s not their fault that their stance against any more accomdative easing this year fell on deaf ears. Blame commodities. Buyers have been fixated on commodity markets. As commodities, including copper and iron ore, crashed into bear markets, forex traders sold AUD in like manner. The $GBPAUD rallied over 20,000 pips. Since MAY. That’s an incredible bull rally, by an measure. Markets simply ignored the RBA. Until this week. Monetary policy action and the statement this week showed an adamant central bank in their stand to allow the interest rate cuts this year to do their work. The RBA even appreciates the weak AUD. It bolsters domestic demand in the face of slowing exports. So no complaints there. Unlike their counterparts in Switzerland, the RBA is happy to have traders do their dirty work. Smart.

The price action and close this week do serious technical damage to this chart right here.


GBPAUD DAILY CHART


This chart is an excerpt from this week’s issue of Quid Report. Subscribers receive my research on all major GBP pairs at the beginning of the week, including access to @faithmightfx on Twitter for daily, real-time updates to the weekly report. AVAILABLE NOW.

RBA Remains Neutral

Since consolidating in a triangle pattern back in March, the $GBPAUD has extended its break of the triangle pattern to stage a breakout rally to 2.1527. This breakout above the 2.000 resistance and major psychological level to highs took out the former highs on both the daily and weekly charts. The monthly chart must be studied for the potential of a continuation higher. Having broken above the large 50% Fibonacci level at 2.0720, this breakout rally now targets the 61.8% Fibonacci level at 2.2217. The break above the 50% Fibonacci level is a very bullish development for the $GBPAUD as it signals that price will continue to move higher. A break of the 61.8% Fibonacci signals a complete reversal. The rout in commodities has been a sore spot for the Australian dollar. Iron ore and copper, two of Australia’s largest exports, have suffered steep declines in price along with oil. Though the RBA did not move on monetary policy last month, they have stated that they were unlikely to ease monetary policy again this year despite its economy softening in the face of commodity weakness. Despite the RBA reducing calls for more easing, AUD selling has not abated. Copper, oil and gold have all opened the new trading week accelerating to new lows. If the RBA can stand firm with this more neutral sentiment in their interest rate announcement this week, the $GBPAUD may begin to turn lower.

GBPAUD DAILY CHART

The $GBPAUD completed its Fibonacci move from last week when it moved to new, multi-year highs at 2.1527. Despite the new, multi-year high in price, momentum is still diverging on the daily chart. This bearish divergence signals for another corrective price move lower in price. As the correction works price lower, momentum should find support at the 60.0 level. This level on the RSI has been a strong support for momentum during corrections in the $GBPAUD since breaking above the all-important 2.00, now turned, support level. With momentum currently out of overbought territory, price will have supportive buying momentum to move the $GBPAUD to new highs again. If momentum were to take out that support level on the RSI that would be a tentative signal that the $GBPAUD may be looking for a reversal. However, the bearish divergence alone is not enough to deter buyers. The $GBPAUD can still rally to new highs but if the RBA continues with more neutral sentiment after their interest rate announcement that could, in fact, trigger a selloff.


This is an excerpt from this week’s issue of QUID REPORT. Subscribers receive my research on all major GBP pairs at the beginning of the week, including access to @faithmightfx on Twitter for daily, real-time updates to the weekly report. AVAILABLE NOW.

CHART OF THE WEEK: THE OZ WAGS AT RBA

Despite the RBA reducing calls for more monetary easing, the $GBPAUD continues to march ever higher on the back of a weak Australian dollar. Quid Report readers are enjoying this pair. While it has exhibited great technical edge, its fundamental edge has developed nicely in recent months for the ultimate double whammy. Trade the currency pairs with a double whammy. This is one.


GBPAUD MONTHLY CHART


This chart is an excerpt from this week’s issue of Quid Report. Subscribers receive my research on all major GBP pairs at the beginning of the week, including access to @faithmightfx on Twitter for daily, real-time updates to the weekly report. AVAILABLE NOW.

CHART OF THE WEEK: IT GETS EASIER

Each week, I highlight a chart out of the Quid Report.

After highlighting the Australian dollar last week, the $GBPAUD continues to soar to new highs. This week, the move out of the Fibonacci levels on the correction lower has moved to new, multi-year highs yet again. Momentum is trying to do something about that bearish divergence as bulls are not to be dissuaded. Between a crashing Chinese stock market, a slowing Australian economy and weak commodities, the AUD just can’t get a reprieve from the selling. It is expected to remain weak too for as long as this fundamental trifecta remains a narrative in the market.


GBPAUD DAILY CHART


This chart is an excerpt from this week’s issue of Quid Report. Subscribers receive my research on all major GBP pairs at the beginning of the week, including access to @faithmightfx on Twitter for daily, real-time updates to the weekly report. AVAILABLE NOW.

The Easy Aussie Dollar

The release of the meeting minutes from the Reserve Bank of Australia (RBA) was met with AUD selling. The RBA maintained its dovish sentiment despite not making any changes to monetary policy at its last meeting. They, too, downgraded their economy. Even though the Australian labor market is still strong, households are laden with debt and are simply not spending money. While officials at the RBA expressed satisfaction with the effects of current monetary policy, they believe policy needs to remain accommodative. It is their assessment that the economy still requires a weak AUD trading at even lower levels. The minutes confirmed the dovish remarks from RBA Governor Stevens just the week prior. As a result, the $GBPAUD continues its rally to new, multi-year highs.

GBPAUD WEEKLY CHART

Momentum continues to build a bearish divergence with every new high. Last week was no exception. There still remains a bearish divergence that suggests the $GBPAUD is due for a correction. Despite the divergence in momentum, the $GBPAUD is in breakout mode. It has soared to new highs and continues to close above the important 2.00 support level. But the decreased buying momentum is glaring. The new highs at 2.0548 were accompanied by even more bullish momentum than last week’s new highs. That is a good sign for buyers this week. It suggests that fresh buyers are back in the market assured by the dovish RBA.

The $GBPAUD has maintained an orderly rally even with the dovish RBA. Momentum followed with building bullish momentum following the rally to new highs. Last week, however, the $GBPAUD established new highs on the daily chart with less momentum than at the previous high price. With diminishing buying momentum on these new highs and a bullish close, a breakout higher could produce a false break. If price is unable to hold above the 2.0344 lows with adequate buying demand, the buy zone at the Fibonacci levels will come into play.


This is an excerpt from this week’s issue of Quid Report. Subscribers receive my research on all major GBP pairs at the beginning of the week, including access to @faithmightfx on Twitter for daily, real-time updates to the weekly report. AVAILABLE NOW.