fbpx

ON AIR with F.A.C.E

I spend every Sunday with students looking at markets for the upcoming trading week. So I was happy to share this week’s insights with Dale Pinkert this morning of the Forex Analytix Community Experience (F.A.CE.). While F.A.C.E. may be a new community, Dale certainly is not. He is an expert trader who has great experience interviewing the best personalities and experts in the business. So it is always an honor to be asked to discuss my views on markets. The nugget I dropped today that Dale really liked:

Correlations are shot. There are no correlations right now in the market.

What do I mean? Watch my interview and market review to find out.

I Survived the Flash Crash

The GBP just crashed in epic proportions. The official number is -5% in 2 minutes and 3 seconds.

GBPUSD 15 MINUTE CHART

It is already being called a flash crash because of the sheer scale of it. And the craziest thing about it is that we were on the right side of it. The following quote is from this week’s Quid Report (Volume 79):

The follow-through lower already this week proves correct the assertion in Volume 76 – that the resumption of the long-term downtrend that is the Great British pound has indeed taken place…It is very likely that this bear trend is the direction sterling trades for the remainder of the calendar year.

The rest of the report this week goes on to outline the setups that took place at the beginning of this week. Most of the targets had been hit before the flash crash except for two trades. These positions are up HUGE.  I haven’t seen this much money on a single trade in a long time.

I SURVIVED THE FLASH CRASH….

So I immediately issued a tweet to all Quid Report readers. This is not verbatim but it was definitely to this effect:

keep calm and carry on

If you were short the GBP ahead of this flash crash – GOOD FOR YOU! KUDOS! How you manage this trade is up to you. But no one will blame you if you close out these positions for all this big money. Taking big profits is the name of the game!

Image credit

ON AIR with Benzinga’s #PreMarket Prep Show

As a sterling trader, I feel inundated by talks of the UK’s upcoming EU referendum vote. Well all forex traders have been feeling the fatigue of Brexit news that has besieged the markets especially when the calendar turned to June. Today is exactly one week from the imminent vote. My homegirl, @piptrain, put this request out into the universe.

So when I got on air with the guys at Benzinga the next day, they toyed with hosting such a panel. In case it doesn’t materialize, hear my thoughts on Brexit and the effects I believe are in store for sterling and how we should trade it.


ON AIR with FXStreet’s Live Analysis Room #FXRoom

GBP has gapped down across the board and the follow through right now is tremendous. I talked with Dale Pinkert, host of LAR #FXRoom, about the Brexit and the levels to watch that $GBPUSD and $GBPNZD. These levels are being challenged right now as the new trading week gets underway.

It’s already Monday and the Friday close is already so important. Neither bears nor bulls should get too excited with these opening flows. Anything can happen this week. Trade it well!

Premium trade setups with targets and stops are published in the Quid Report.

Strong Yen Implications

The $GBPJPY continues to slide. The Japanese yen rally has become sustainable as the Bank of Japan (BoJ) continues to give indications that it is considering a shift away from its quantitative and qualitative easing (QQE) program. This is a very subtle shift in BoJ sentiment that is not getting much media attention. Less QQE means that the BoJ erodes at the divergence gap in monetary policy that it has had with other major central banks for several years. Manufacturing PMI released last week was higher than expected, helping to confirm the BoJ’s optimistic economic outlooks for Japan. This hawkish tone is helping to strengthen the Japanese yen now at a time when risk aversion flows may be re-entering capital markets. The geopolitical wars and diplomacy tensions around the globe are starting to wear on investor sentiment. As U.S. equities weaken, the Japanese yen continues to be the largest beneficiary of increases in risk aversion flows. The new trading week opens with the $GBPJPY trading at extremely oversold levels. Despite its bearish sentiment in the medium term, the $GBPJPY may consolidate the new lows below the major 170.00 psychological level.

GBPJPY WEEKLY CHART

The $GBPJPY has not staged a correction since breaking below the 184.00 support level back in early December. The break below the 175.00 support level with the extremely shallow rallies is a major signal of bear strength as the $GBPJPY continues to grind lower. The $GBPJPY breaks nominally below the 170.00 psychological level as the new trading week begins, subtly indicating that the staunch support level is being met with more bearish psychology than last year. Perhaps with the RSI at extremely oversold levels, the $GBPJPY will bounce higher as sellers exhaust. A “healthy” correction off the new 169.30 lows moves the $GBPJPY back toward the 175.00 level to the sell zone starting at the 173.45, 38.2% Fibonacci level. Sellers are lined up to the 176.00 resistance level. Given the importance of the 170.00 support level on a bearish move that has seen very little retracement, a strong bounce is highly likely. More aggressive traders will look to take advantage of any move higher to establish a short position in the $GBPJPY. Continued strength in the Japanese yen is likely especially as crude oil prices remain so low, which is an aide to the Japanese economy.

Premium trade setups with targets and stops are published in the $GBPJPY Outlook for the Week in Volume 45, this week’s Quid Report.

QUID REPORT LIVE

Due to the holiday shortened week and it being the very last week of 2015, no Quid Report was published this week. Instead, I am doing a video update to last week’s written report. While I have been on many forex shows, this is my first time hosting a live broadcast. This should be a quick update and review for the week in progress. Enjoy! And please leave your feedback in the comments. Perhaps this will be a new thing for me in 2016.

Yen Strength Can’t Persist

The Bank of Japan (BoJ) has not objected to the recent strength in the Japanese yen. The Japanese yen continues to benefit from the risk aversion flows that are clamoring back into the markets when equity markets crashed around the globe. The recent move lower in U.S. equities has been highly correlated with a stronger Japanese yen due to risk aversion flows in the market. This week, however, risk appetite looks to fuel safe haven selling. Additionally, the BoJ may look to increase its already substantial QE program as early as next month. With deflationary pressures still prevalent in the Japanese economy and signs of softening economic data, the GBP/JPY may not be able to continue its descent lower (Volume 31). The weakening Japanese fundamentals is likely to support a rally in the GBP/JPY on the back of sustained JPY weakness. With the recent lows holding in the buy zone above the 61.8% Fibonacci level, a Fibonacci move could spark a rally back to the 195.50 highs.

GBPJPY 4 HOUR CHART

After falling to 180.34, the GBP/JPY staged a corrective rally in the two weeks ago to the 50% Fibonacci level. Making a new high at 188.26 on Federal Reserve volatility in the sell zone, the GBP/JPY made new lows last week to 180.66. Into the end of last week, selling momentum exhausted and price moved higher. The now failed lows signal a move higher for the GBP/JPY. Future direction will be largely dictated by the capital flows in U.S. equity markets. The failed lows in the GBP/JPY also coincide with the aforementioned failed low in the S&P 500. Increasing strength in the S&P 500 will have to overcome the key 2040 resistance level to see a new high higher than the previous 188.26 high in the GBP/JPY. Though a new high can still respect this sell zone, a sustained rally in U.S. equities supports a complete reversal in the GBP/JPY back to the highs. If, however, the S&P 500 retests the 1867 lows, the GBP/JPY can move lower from current levels to its zone of support between 176.20 and 174.86. A confirmed close below the 181.00 support level becomes an early signal of a continuation lower. A confirmed close above the 184.00 resistance level signals a move back to the previous highs above the 188.00 level.

Outlook for the week…


This is an excerpt from this week’s issue of QUID REPORT. Subscribers receive my research on all major GBP pairs at the beginning of the week, including access to @faithmightfx on Twitter for daily, real-time updates to the weekly report. AVAILABLE NOW.

Is This The Bottom?

Last week, I was on the air live with Dale Pinkert, host of FXStreet’s Live Analysis Room. My episode is down below. It’s always fun talking GBP with Dale because he always has insights to share with me as I do with him. His experience in futures on top of the forex always leads to a good conversation. The interview never feels like an interview. Just good trading talk between friends.

The interview took place the day before the September non-farm payrolls dropped. You’ll hear us talk equities quite a bit. With the weakness in the $SPX, I explain why the $GBPJPY was actually looking to fall further to 174.86 and possibly even as low as 167.99. But the weakness in the NFP report may change everything. Apparently, Yellen and the $FED did know something we all didn’t know. The recent global malaise in China, Syria and Brazil are, in fact, starting to show ripple effects in the U.S. economy. And if this economic weakness becomes a trend, interest rate hikes out of the Federal Reserve are off the table. Probably completely. Definitely for 2015. The lack of wage growth and the less-than-expected jobs growth has finally convinced markets that the $FED is not moving on interest rates. In fact, whispers of QE4 are back. Expect that drum to beat louder if the U.S. economy starts to show more weakness in the months ahead.

Looking at the $GBPJPY as our equities proxy, the Friday close above the 181.00 support level is a bullish signal in light of the strong close in the S&P 500. Watch here:

Is Risk Aversion Here To Stay?

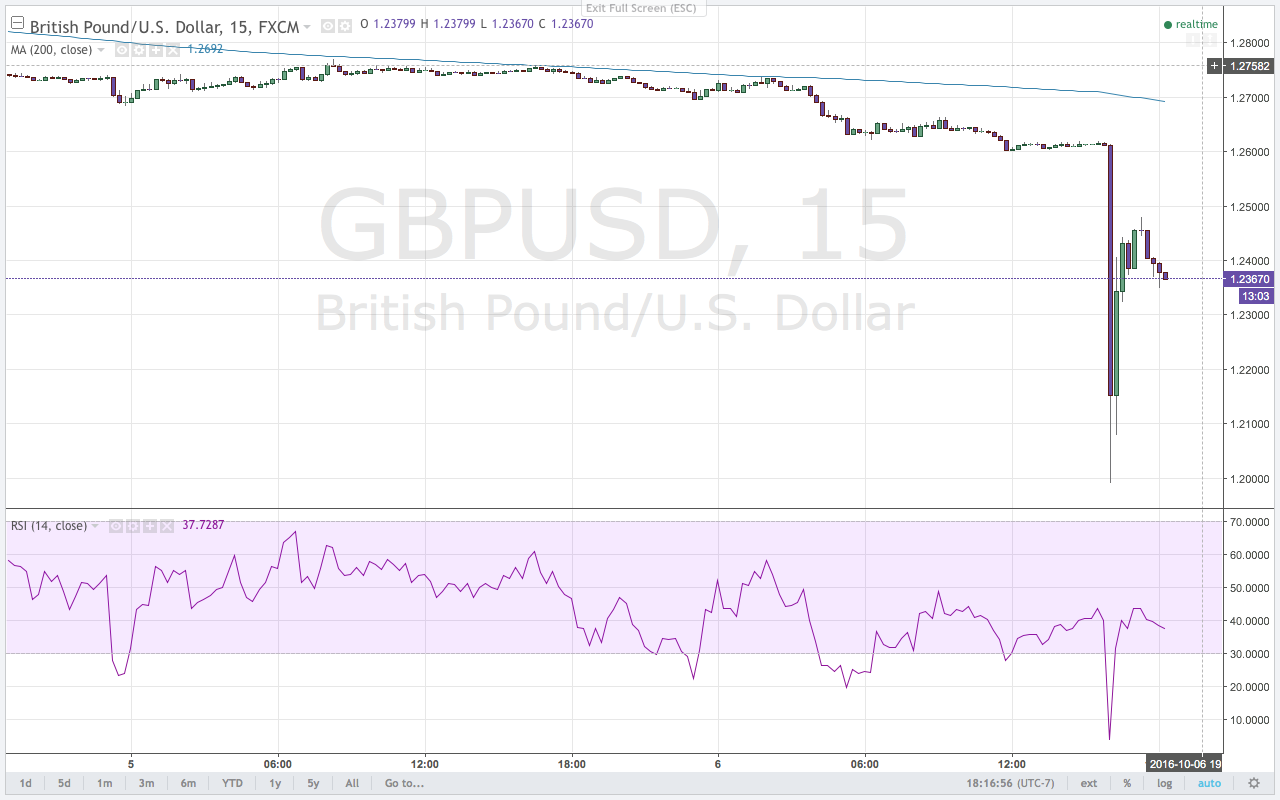
The Japanese yen has found new strength on the back of risk aversion flows. It is one of the biggest beneficiaries as a safe haven currency. With the Swiss National Bank intervening to prevent safe haven flows from strengthening the Swiss franc and the U.S. dollar dealing with new interest rate expectations, the JPY has received a bulk of the risk aversion flows in the market. Evidence of this is the huge gap down the $GBPJPY experienced when the new trading week opened compared to the $GBPUSD or GBP/CHF. As the Greek debt crisis now deals with this new normal — a rejected austerity plan and debt repayment package — the $GBPJPY may continue to move lower.

GBPJPY WEEKLY CHART

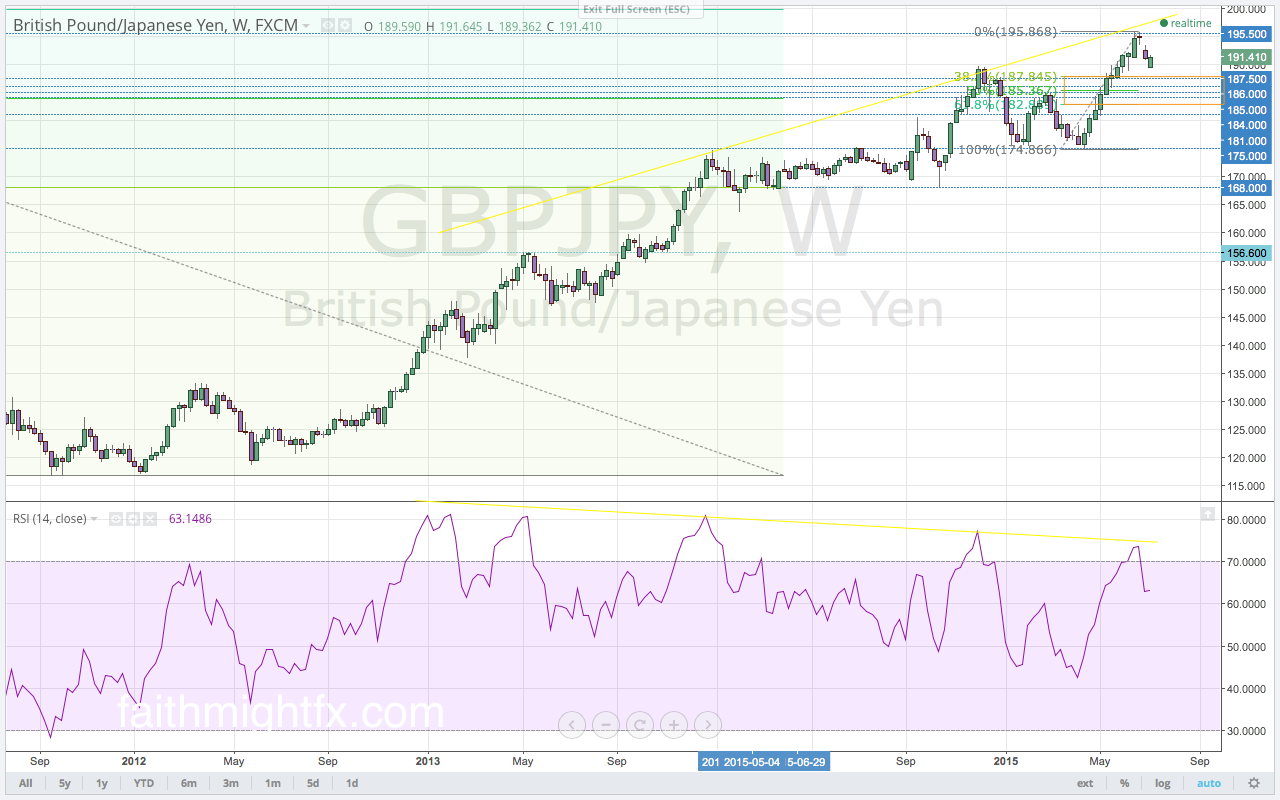
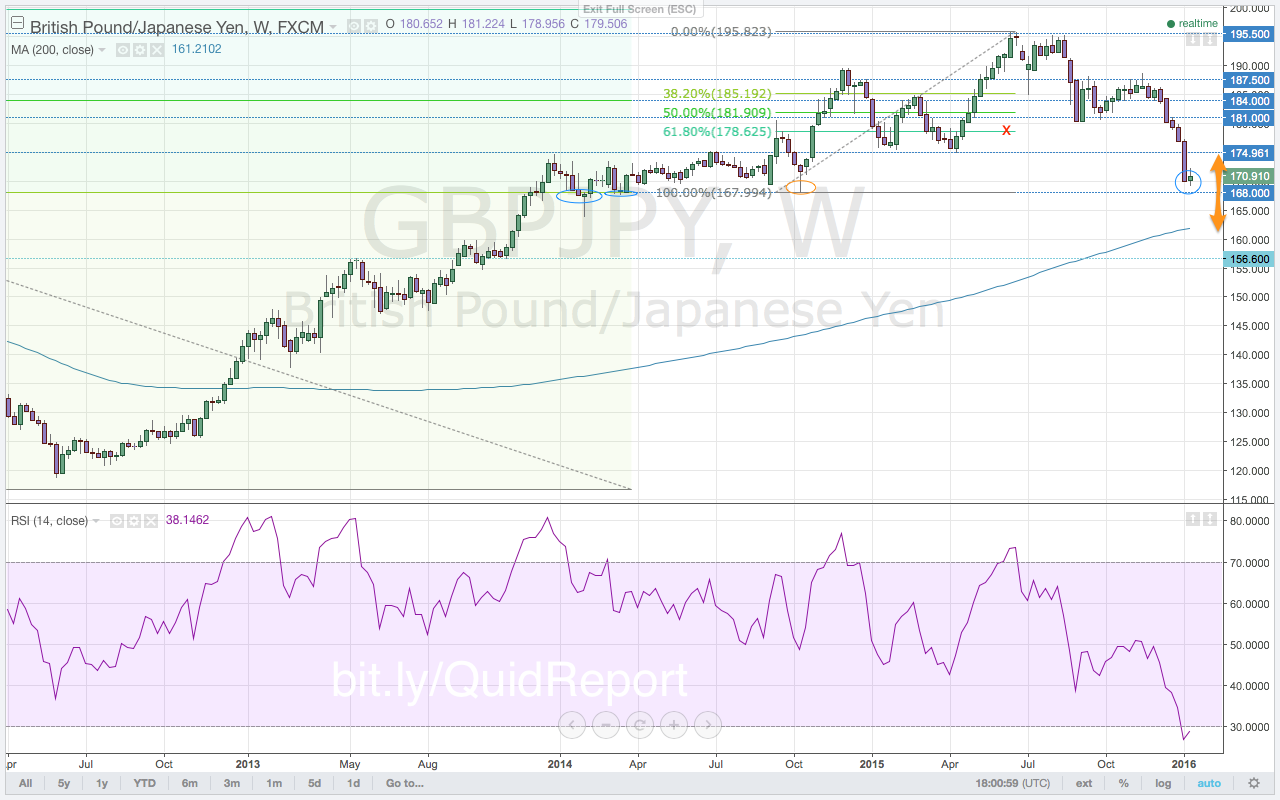
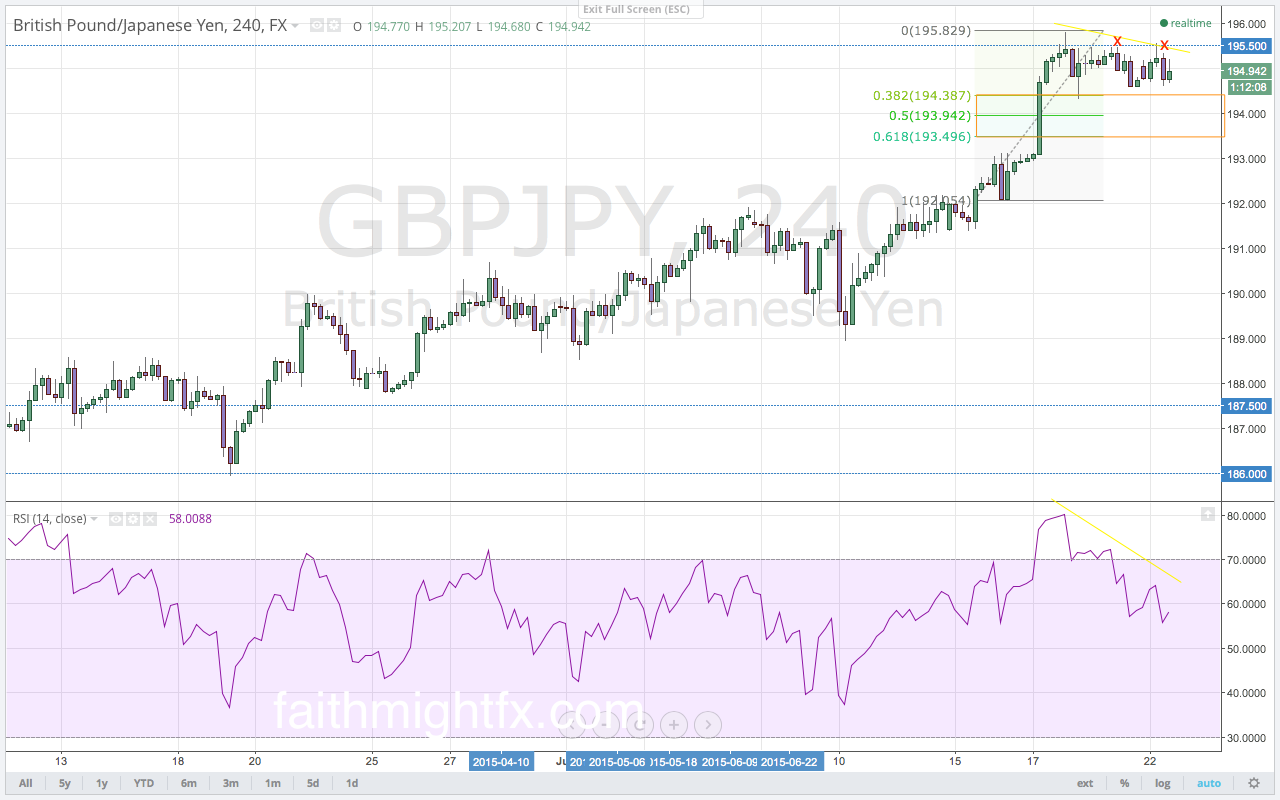
The $GBPJPY made a new low at 189.59 [on Monday], establishing a level of support for the week. A move below the gap low targets the 38.2% Fibonacci level at 187.84. The major support and psychological level at 1.9000 is the level to watch for direction in the new trading week. The prior bullish wave already found resistance just ahead of the 1.9000 level at 189.68. Last week’s bounce higher after the gap down still has yet to fill the gap even as the bounce higher this week has already filled the gap. A continued inability of the $GBPJPY to fill its own, very large gap is a bearish signal. Coupled with the building bearish divergence between price and momentum at the recent 195.86 new highs, the $GBPJPY is poised to move into a deeper correction of the entire rally off the 175.00 major support level.

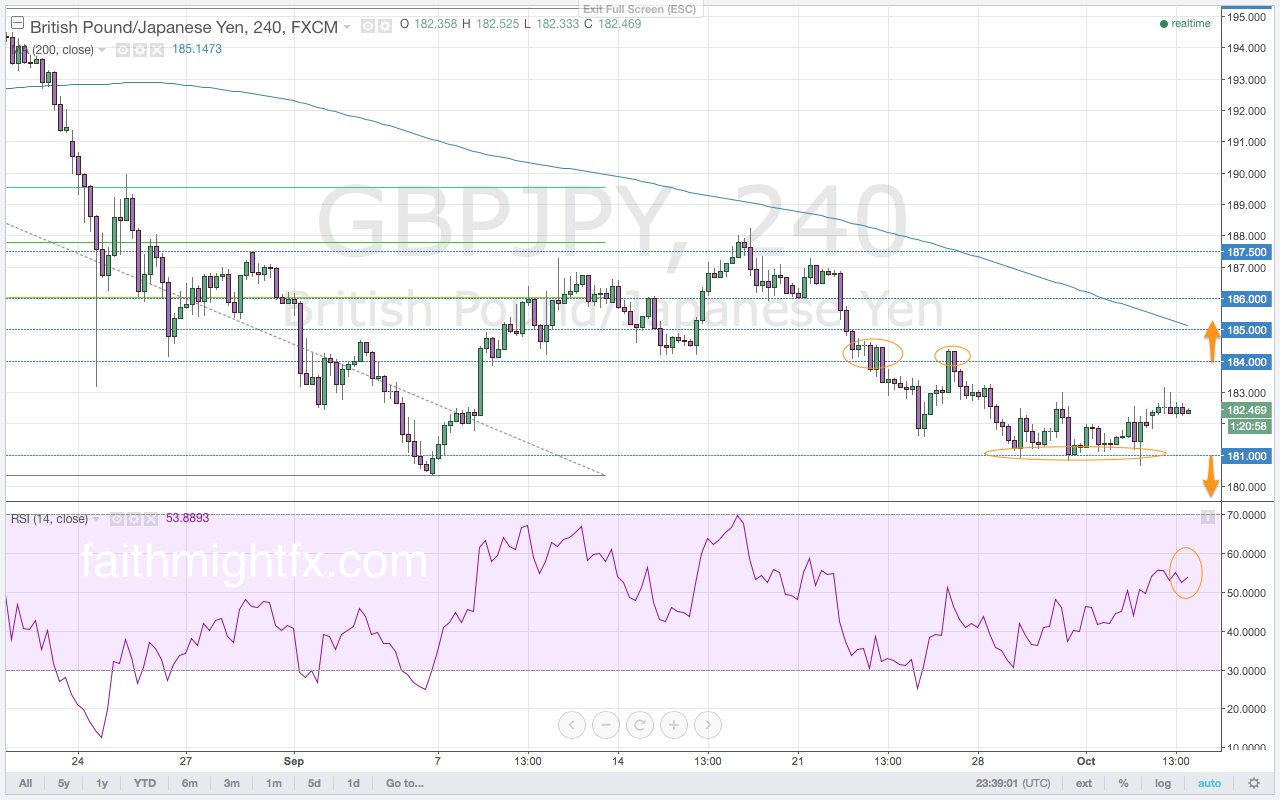
Momentum on the daily chart waned very sharply at the highs last week. This sharp decline in buying momentum resulted in multiple false breaks of the 195.50 resistance level. Though the gap lower is due to fundamental reasons, its occurrence lines up with the technical developments over the last several trading sessions. Already lower than the previous low on the RSI, this new selling momentum has broken below the 50.0 level into bearish territory. The gap lower this week has broken below the major 190.00 support level. However, that price move lower was immediately met with bids that rallied price right back above the 190.00 level to a high of 191.64. These highs are finding resistance ahead of last week’s lows. If the $GBPJPY is unable to move higher, it is likely that price will fall back towards the 190.00 support level.


This is an excerpt from this week’s issue of Quid Report. Subscribers receive my research on all major GBP pairs at the beginning of the week, including access to @faithmightfx on Twitter for daily, real-time updates to the weekly report. AVAILABLE NOW.

CHART OF THE WEEK: FAILURE MEANS SOMETHING

Each week, I highlight a chart out of the Quid Report.

The $GBPJPY failed above the 195.50 resistance level all week. Now that $GBPJPY has moved lower off these highs this week, is it now ready to break higher?


GBPJPY 4 HOUR CHART


This is an excerpt from this week’s issue of Quid Report. Subscribers receive my research on all major GBP pairs at the beginning of the week, including access to @faithmightfx on Twitter for daily, real-time updates to the weekly report. AVAILABLE NOW.