fbpx

The Pound to Gain Against the US Dollar

Pound To Gain Against The U.S. Dollar

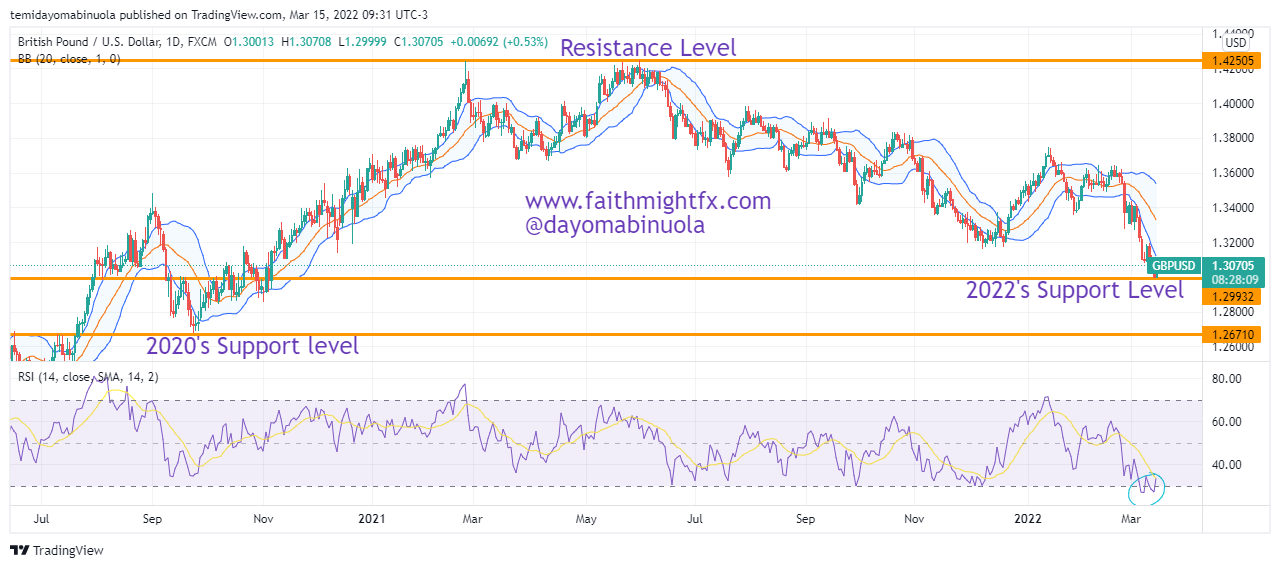
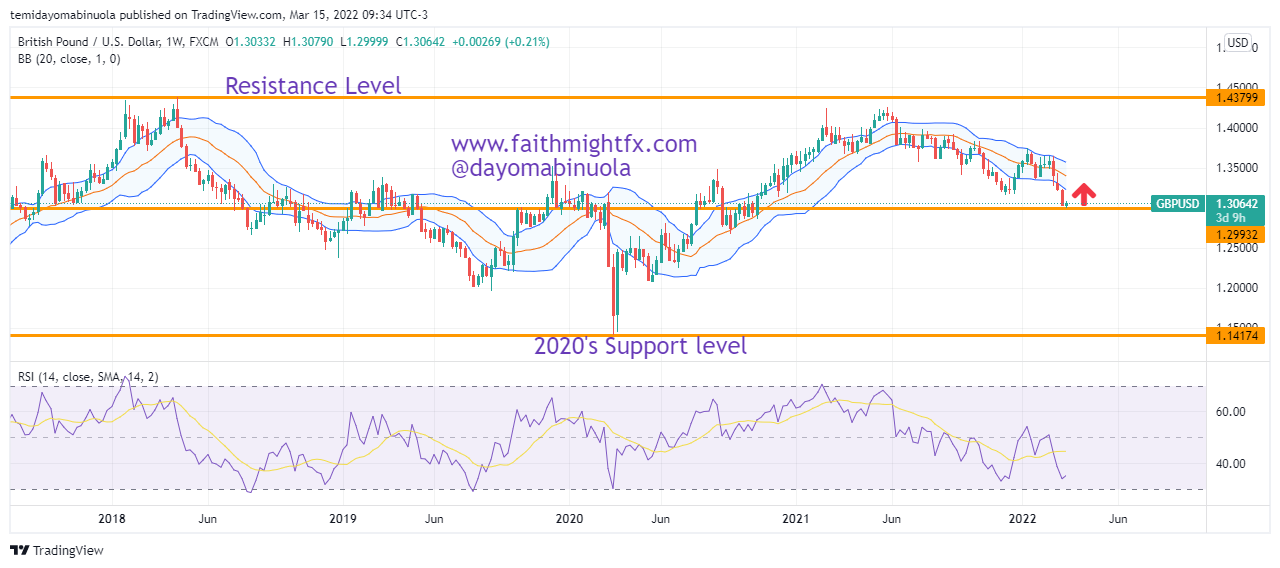
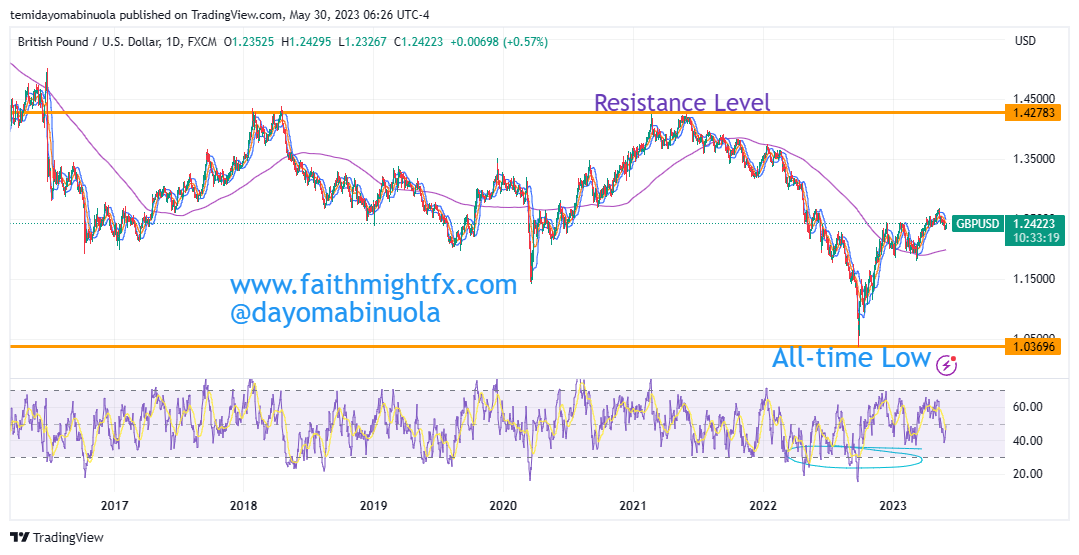
The GBPUSD pair has been in a bearish movement since the beginning of 2021. The support level of GBPUSD stands at 1.03696, which was reached in September 2022. This point also stands as the all-time low of the pair. After this low, price rallied through the rest of the year, that is, in October, November, and December of 2022. The bullish momentum continued in 2023 as the bulls began to push price to new highs.

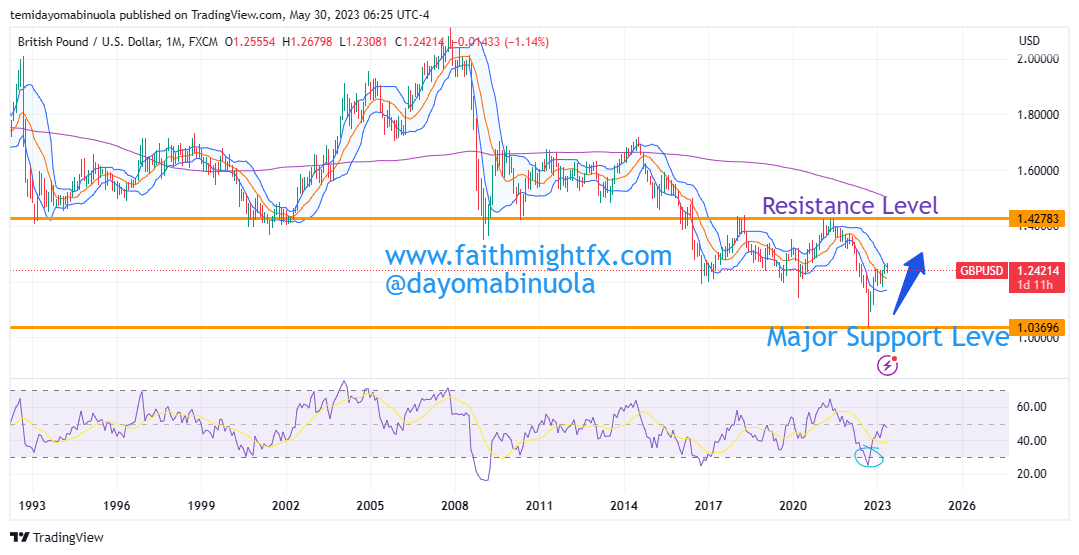
As it stands, the dollar has continued to lose its strength against the pounds. The GBPUSD bulls could push price higher in the coming weeks. The price could reach 1.25000. The current price as of the time of publishing this article is at 1.24210. On the monthly chart using the RSI, the price has been oversold. The candlesticks are in the upper region of the Bollinger Bands. There are higher lows and higher highs already being formed on the daily chart. If in the short-term, price is able to hit 1.25000 as mentioned above, then we forecast that the bulls might be able to push price to 1.26000 later in the year.

Some of these ideas are in our clients’ portfolios. To understand if this one can work for you or for help to invest your own wealth, talk to our advisors at FM Capital Group. Would you like more information on how to get currencies in your portfolio? Schedule a meeting with us here.

GBPUSD Finds New Support Level

In March 2020, $GBPUSD went as low as 1.14144. After this low, the bulls took over and a rally pushed the price to 1.42614, the highest price between 2018 and now. $GBPUSD opened at the beginning of the year 2022 at 1.35313. Since the beginning of the year, the price has appreciated from the opening price to 1.37512 which is currently the year’s high. The bulls however could not maintain this momentum as the bears hijacked the trend and pushed the pair to a new support level at 1.30020.

This new support level is lower than the opening price of the year which means GBP has lost all it gained this year against the USD. There are indications of a bullish run in the next couple of weeks which signifies that GBP will appreciate against the USD. On the daily time frame, RSI has indicated that the price is oversold. We forecast that the price will rise to 1.34298.

Some of these ideas are in our clients’ portfolios. To understand if this one can work for you or for help to invest your own wealth, talk to our advisors at FM Capital Group. Would you like more information on how to get stocks in your portfolio? Schedule a meeting with us here.

ON THE AIR with ForexAnalytix

I had a great time with Dale Pinkert over at F.A.C.E. a couple weeks ago. It has been awhile since I have shared my thoughts with an audience in that way. Dale and I go way back so we gist a bit but the chat kept us on topic LOL. You can see the highlights on Instagram already if you follow us there.

Jump to the 24:40 mark to hear my thoughts on:

  • $EURGBP in a failing rally that is still playing out this week
  • $GBPJPY buy opportunity
  • How the almighty dollar has been a both a winner AND a loser
  • And, venture capital in Africa. I’m grateful to Dale for honoring my growth into other asset classes and his willingness to learn about them all. This is why investors and traders, alike, love to speak with Dale.

Some of these ideas are in our clients’ portfolios. To understand which ones can work for you or for help to invest for your own wealth, talk to our advisors at FM Capital Group. Would you like more information on Investment Advisory, Portfolio Services, and VC? Schedule a meeting with us here.

ON THE AIR with The Trader’s Vibe

Last month, I had the pleasure of speaking with a new traders community. Led by Carl Burgette, The Trader’s Vibe is a new weekly video podcast series where Carl interviews notable and prominent traders every week. To be considered notable and prominent in this business is truly an honor so I was happy to join him on the show. As with any new community, we spent much of the time talking about my background and how I entered into finance (which is a very unorthodox path, to say the least). Of course, we talked markets and what I was seeing at that time in the GBP. However, this was the first time that I was asked about how I’ve been treated as a woman in the business and my thoughts on bringing more women and people of color into finance.

Catch my episode of The Trader’s Vibe below. Enjoy!


If you are interested in learning how to read and analyze stock & forex charts on your own, please check out the CHARTS101 course. Read the charts for yourself so you can trade what you see and not what I think.

Quick Take: GBP/USD

After some initial volatility to start the new trading week, the $GBPUSD has found support around the 50% Fibonacci level of the rally over the past 2 weeks. U.S. dollar weakness is starting to take hold as the market looks at all of the uncertainty brooding for the U.S. Between the election, the lack of a 2nd covid relief bill and the subtle breakouts of a coronavirus second wave across the country, the market has started to dump the safe haven currency.

GBPUSD 4-hour chart

It is important to note that the 1.30 major support level is just below that 50% Fibonacci level. That level is lending some extra support to $GBPUSD bulls. If cable can continue to hold above these 2 levels, it looks like this rally continues higher towards 1.3250.

However, the event risk to consider for this pair this week includes the release of US GDP, US personal spending & personal income and US consumer confidence. And, of course, Brexit headlines continue to spook markets as unscheduled surprise events.


If you are interested in learning how to do fundamental analysis and find levels in your trading, please check out the CHARTS101 course. Read the charts for yourself so you can trade what you see and not what I think.

Can Dollar Weakness Finally Trend?

I have been harping on USD weakness for months now (here and here and here). Amazingly, during that time with poor U.S. economic data releases and stocks recovering, the USD has remained rangebound. Bouts of weakness have been met with strong bouts of buying since April. When looking at the $GBPUSD, the 1.2634 resistance level has remained that line in the sand for buyers and sellers. Until we get a break above 1.2634 that stays above the 1.2775 resistance level, we won’t see sustainable selloff in the USD.

GBPUSD DAILY CHART

Despite the jockeying between buyers and sellers, the $GBPUSD is trending higher with higher lows and higher highs. This indicates that the USD does continue to weaken more and more. A hold above the 1.2775 resistance level will see the $GBPUSD head towards the highs on the daily chart above the big 1.3000 level. However, another false break above 1.2634 could send $GBPUSD back into a correction that targets the 50% Fibonacci level at 1.2114 or lower.


If you are interested in learning how to find and use these levels in your trading, please check out the CHARTS101 course. Read the charts for yourself so you can trade what you see and not what I think.

ON THE AIR with Market Overtime with Nicole Petallides

I joined Market Overtime with Nicole Petallides to talk about the longer term trends presenting right now in the currency markets. This was my first time on the show. Weak GBP remains the prevailing theme in forex right now. Listen to hear why. Enjoy!


If you are interested in learning how to find and use these levels in your trading, please check out the CHARTS101 course. Read the charts for yourself so you can trade what you see and not what I think.

ON THE AIR with F.A.C.E.

Today, I spoke live with over 200 traders in the Forex Analytix Community Experience (F.A.C.E.) about what the opportunities are in GBP for the new trading week ahead. With multiple pairs ending the previous trading week at major support levels, there were several great opportunities to share with traders live in the market on camera. That’s always great. I hope everyone who caught me live is doing some trade management now on those trades. We have some great moves already in the $GBPUSD and $GBPJPY. In case you missed it, do study the replay below.


If you are interested in learning how to find and use these levels in your trading, please check out the CHARTS101 course. Read the charts for yourself so you can trade what you see and not what I think.

What’s Going on With the U.S. Dollar

With everything the Fed has done to loosen monetary policy, the USD should be far lower. But the reserve currency is in high demand during this time of disease and civil unrest. Though it will be a back and forth, tug of war, I still believe that the USD weakens in the face of unprecedented expansion of the Federal Reserve balance sheet.

GBPUSD 1 HOUR CHART, JUNE 16

This is a short-term view of Tuesday’s price action in the $GBPUSD. After bottoming below the 1.25 level, cable managed to rally over 200 pips before topping out at 1.2688. Upon Powell’s testimony during the U.S. session, the USD rallied as traders dialed down their risk appetite with price finding support in the Fibonacci levels.

Well, this is where $GBPUSD stands just a day later:

GBPUSD 1 HOUR CHART, JUNE 17

The break below the 61.8% Fibonacci retracement level is a signal for a move lower. But that will be highly dependent on how the market reacts to the Bank of England monetary policy decision tomorrow morning.


If you are interested in learning how to find and use these levels in your trading, please check out the CHARTS101 course. Read the charts for yourself so you can trade what you see and not what I think.

THE TRADERS SUMMIT

When my friends at Forex Analytix asked me to join their amazing speakers line up, I was thrilled. I was honored to join the event on April 30, 2020 and speak with new traders, in particular, about how to be successful in the forex market and help all traders with some insights on the GBP. Watch the replay of my presentation below and find the entire 2-day event on their Youtube page.