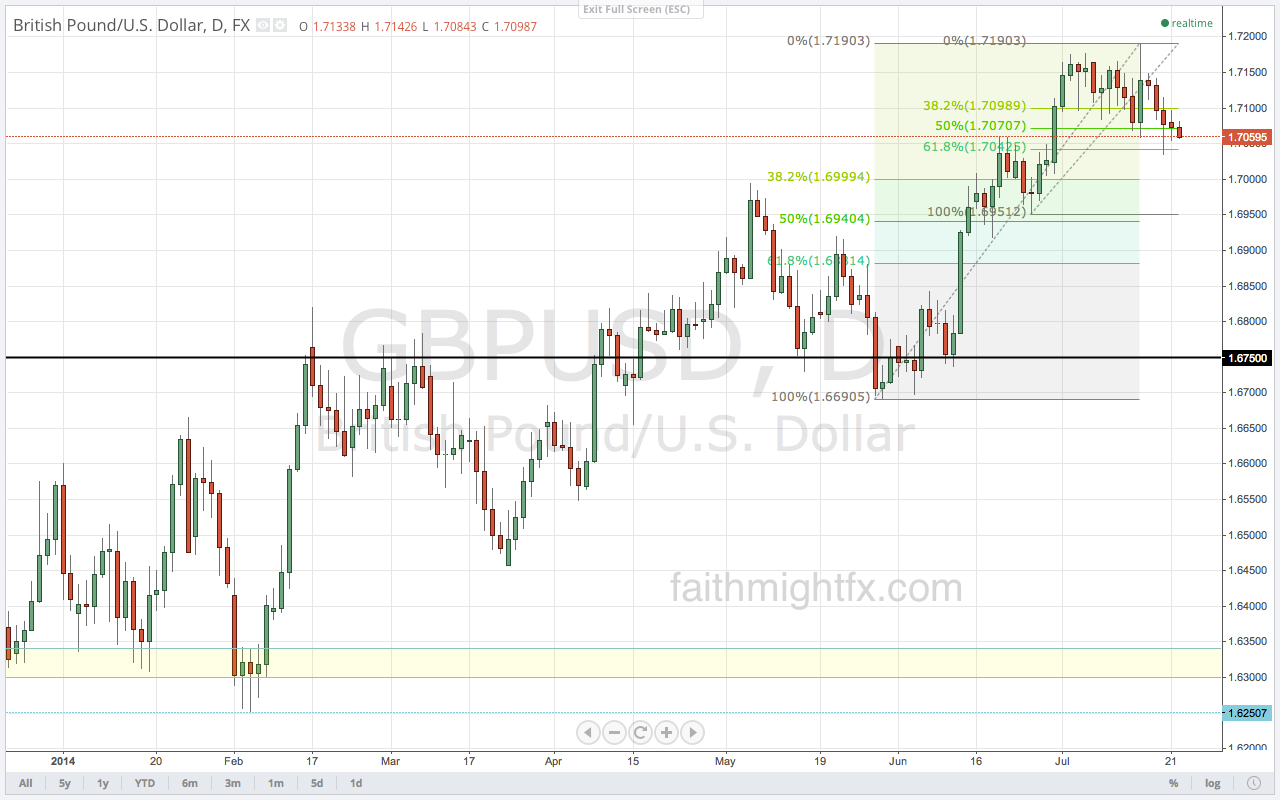
The $GBPUSD finally returned to 1.7000 and closed last week below the big psychological level. Many would find this a bearish signal. And I don’t blame them. Many a trader know the rules of support and resistance. So it is not surprising to find that as the new trading week opens today that we find price meeting offers lined up at the 1.7000 big fig. And that would certainly seem like another bearish signal: price finding resistance at the former support level.
The problem with these technical signals is that the fundamental picture remains pretty much the same. Despite the neutral tone and backpedaling from the Bank of England, sterling fundamentals are still strong enough. Yes, the market is reacting to a less-hawkish-than-preceived Carney. But as long as the economic data remains robust, traders will bet on the fact that Carney & Company will have to respond with some type of monetary tightening sooner rather than later. When that realization hits the market, the bulls will step back in.
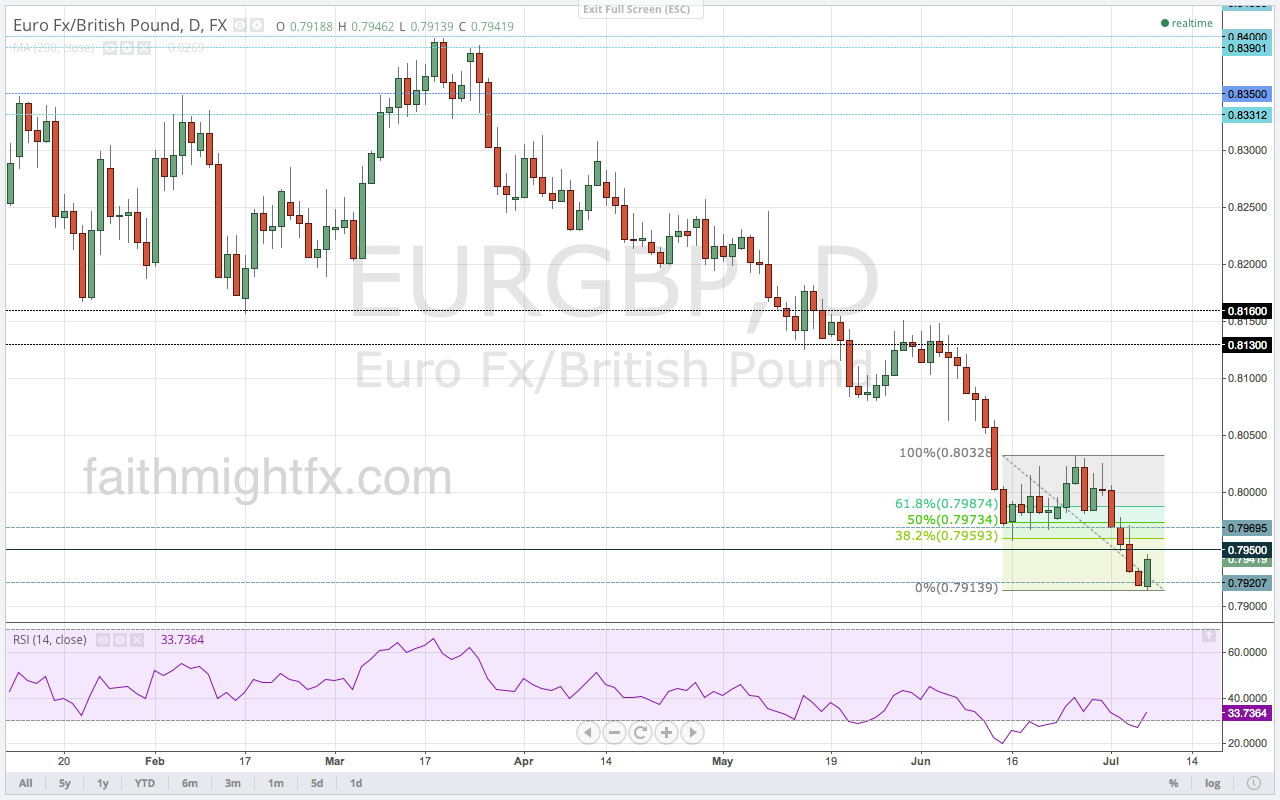
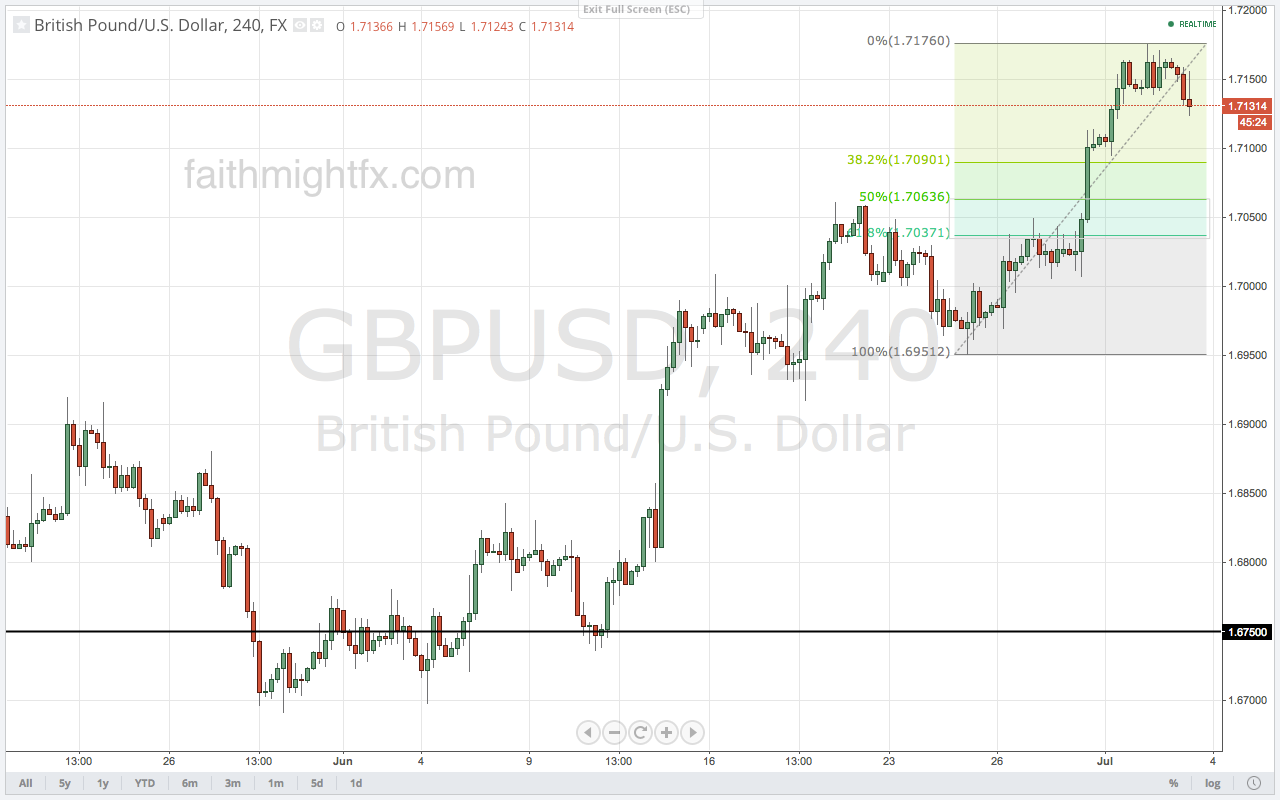
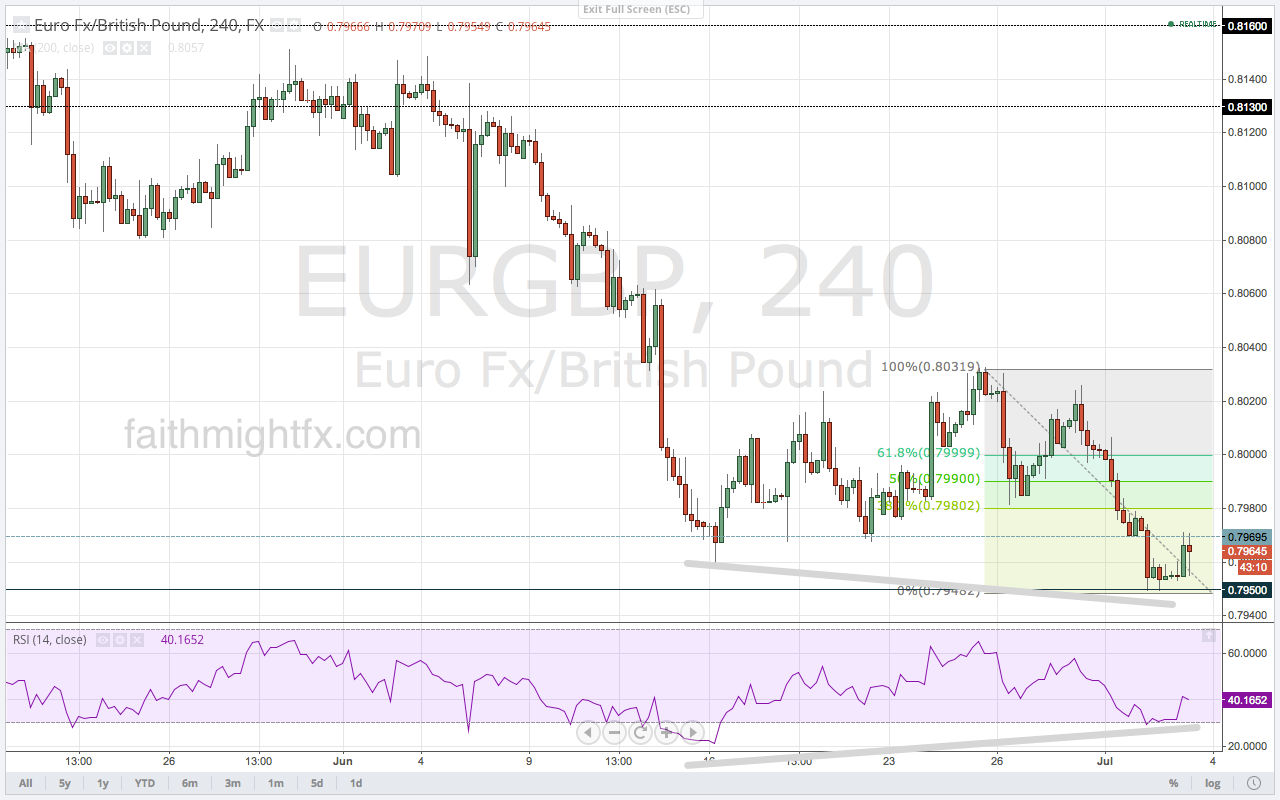
It seems to me that the bulls are still safe. Despite the stalling at highs 2 weeks ago and the inevitable selloff this week, sterling looks well-poised to begin its move higher from current levels. The charts look great with the selloff in $GBPUSD right into 1.6950; and the rally in $EURGBP capped by 0.7950. If these areas of support for sterling hold, it could be off to the races as sterling pushes higher again. But has there been a fundamental change that would support further GBP weakness? This rally has been fueled, first, by economic growth and, now, by interest rate hike expectations. The market will, however, pay attention if the data misses reported throughout this month become a trend. And such a trend will temper the market’s expectations for interest rate hikes. What happens when the BoE decides instead to taper its QE program? Or if the $FED does raise interest rates? How safe really is this GBP rally? Consider it is safe for now.
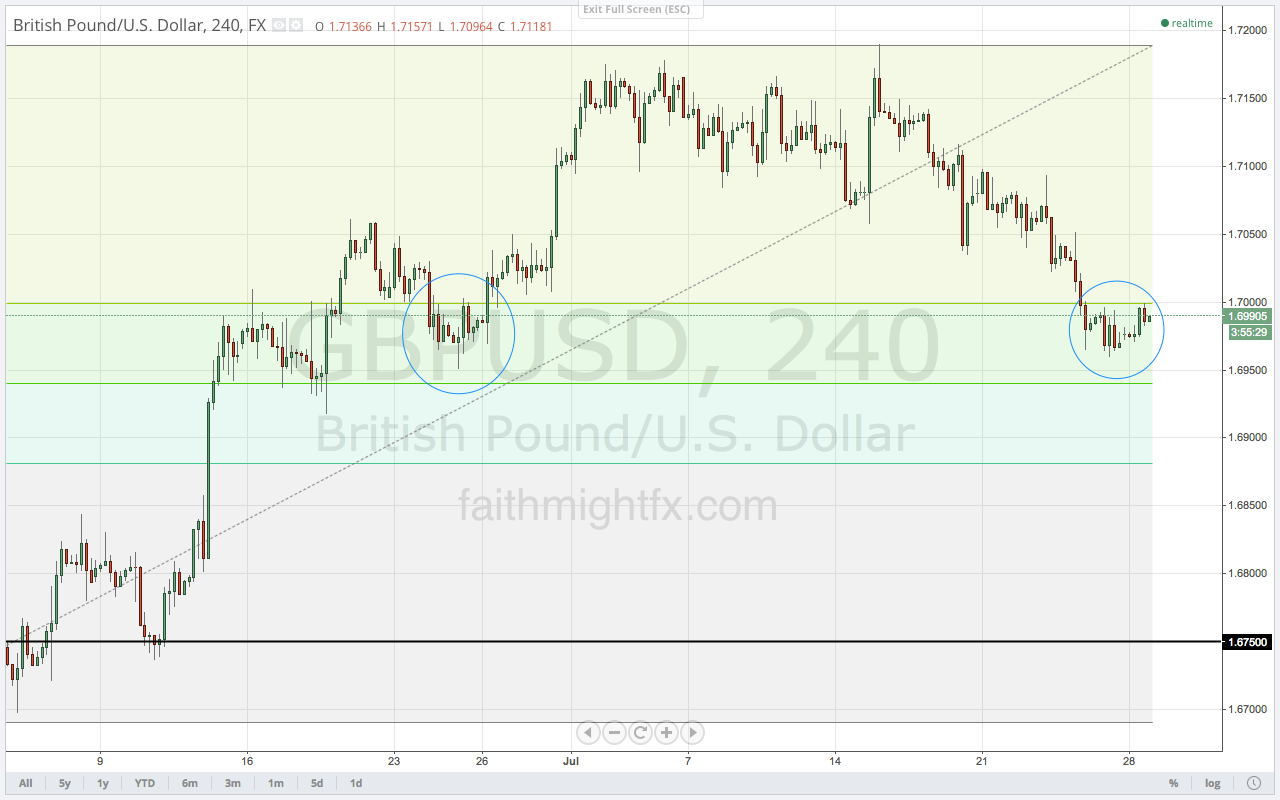
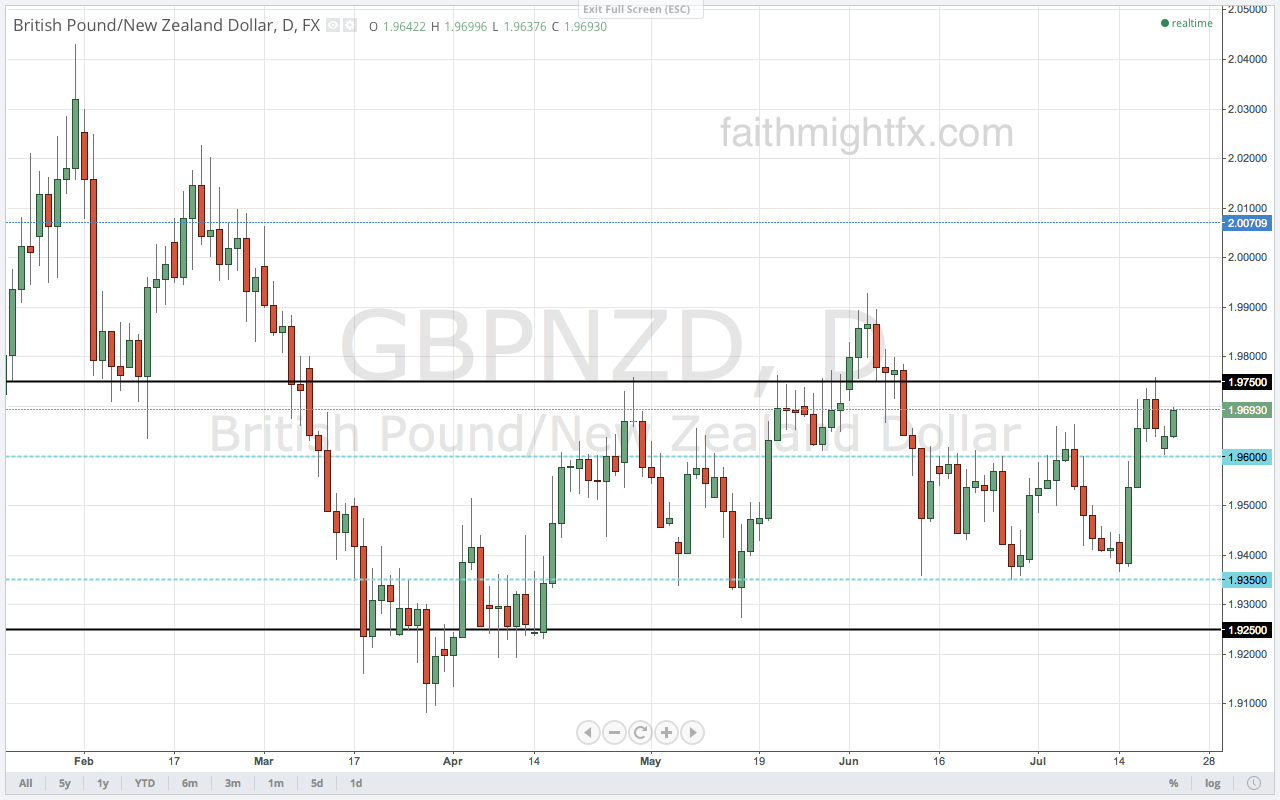
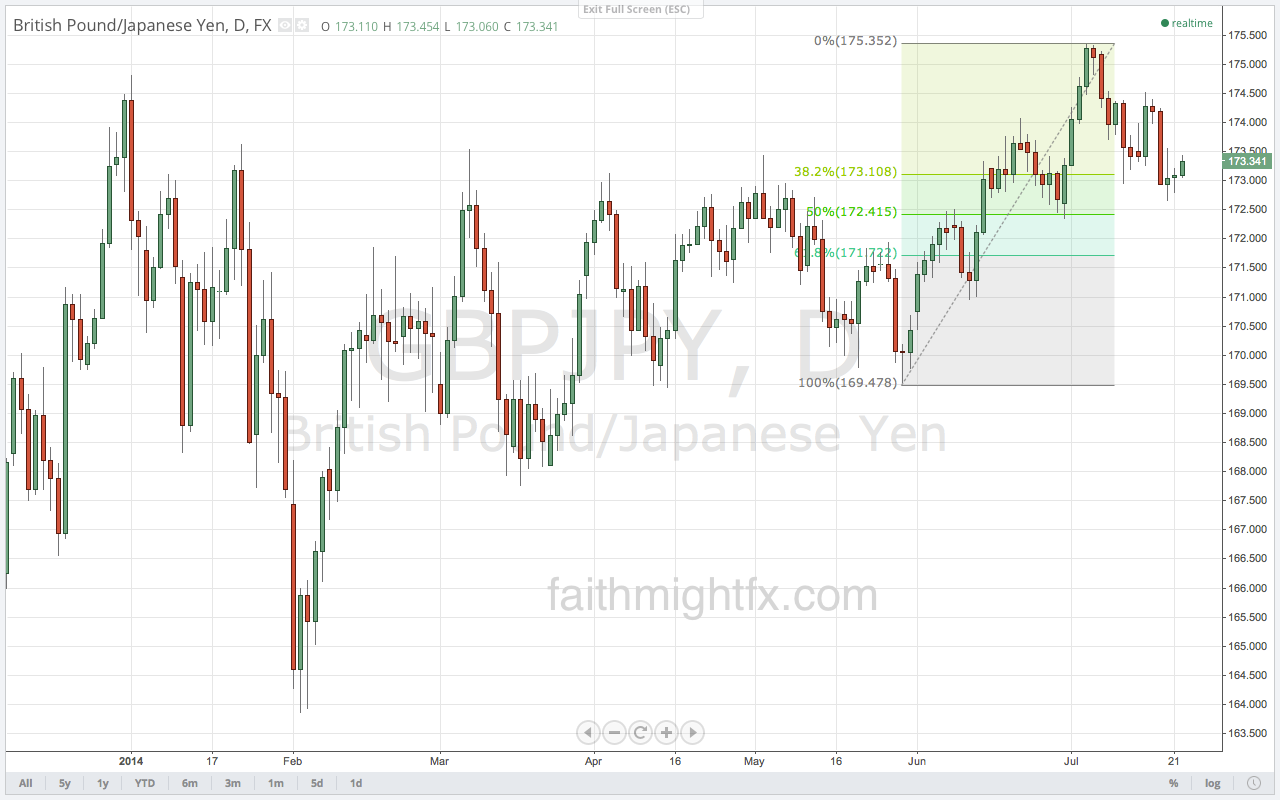
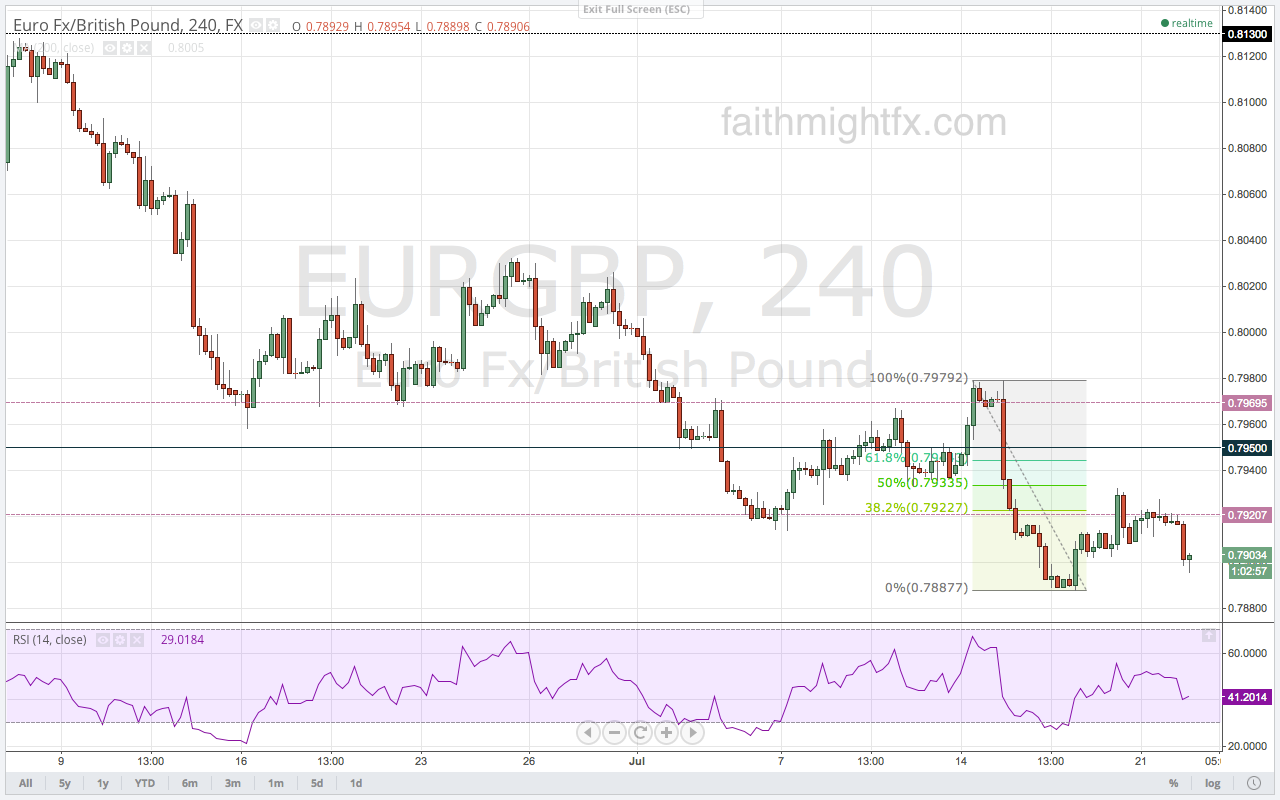
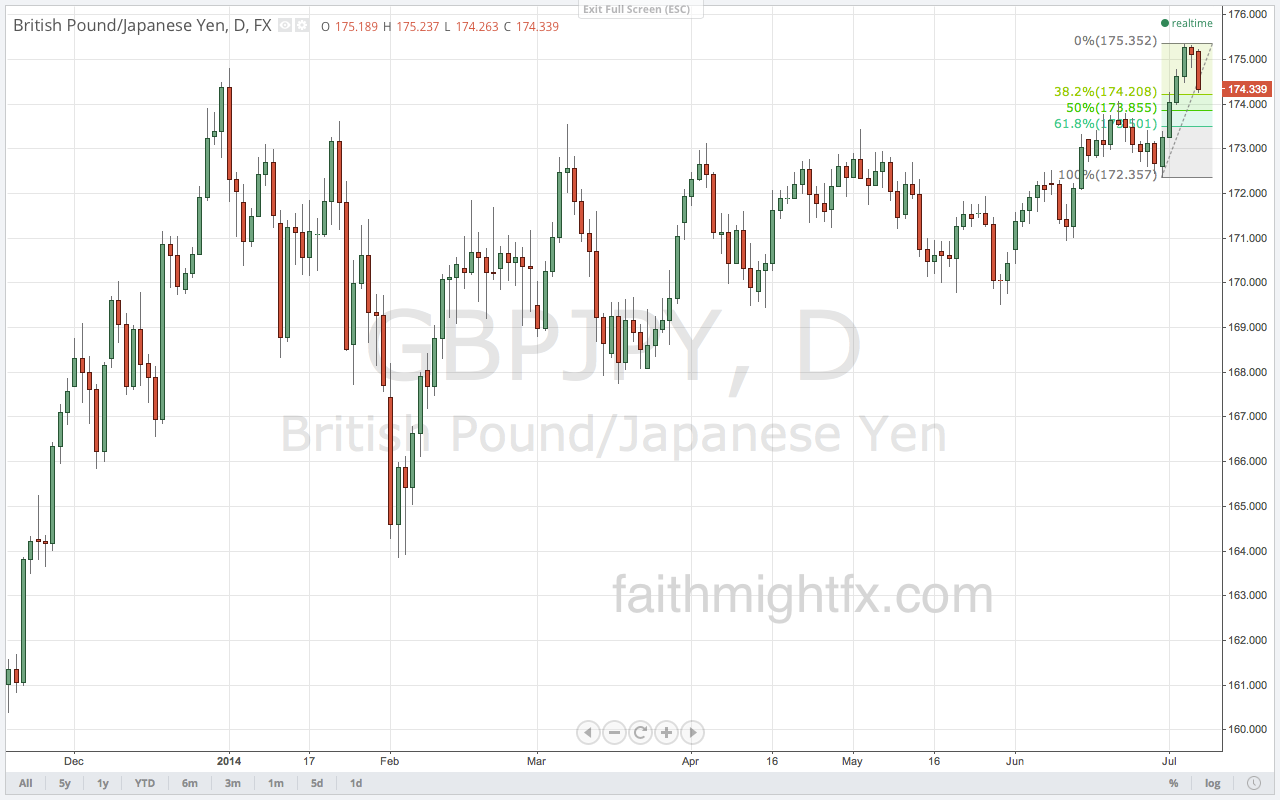
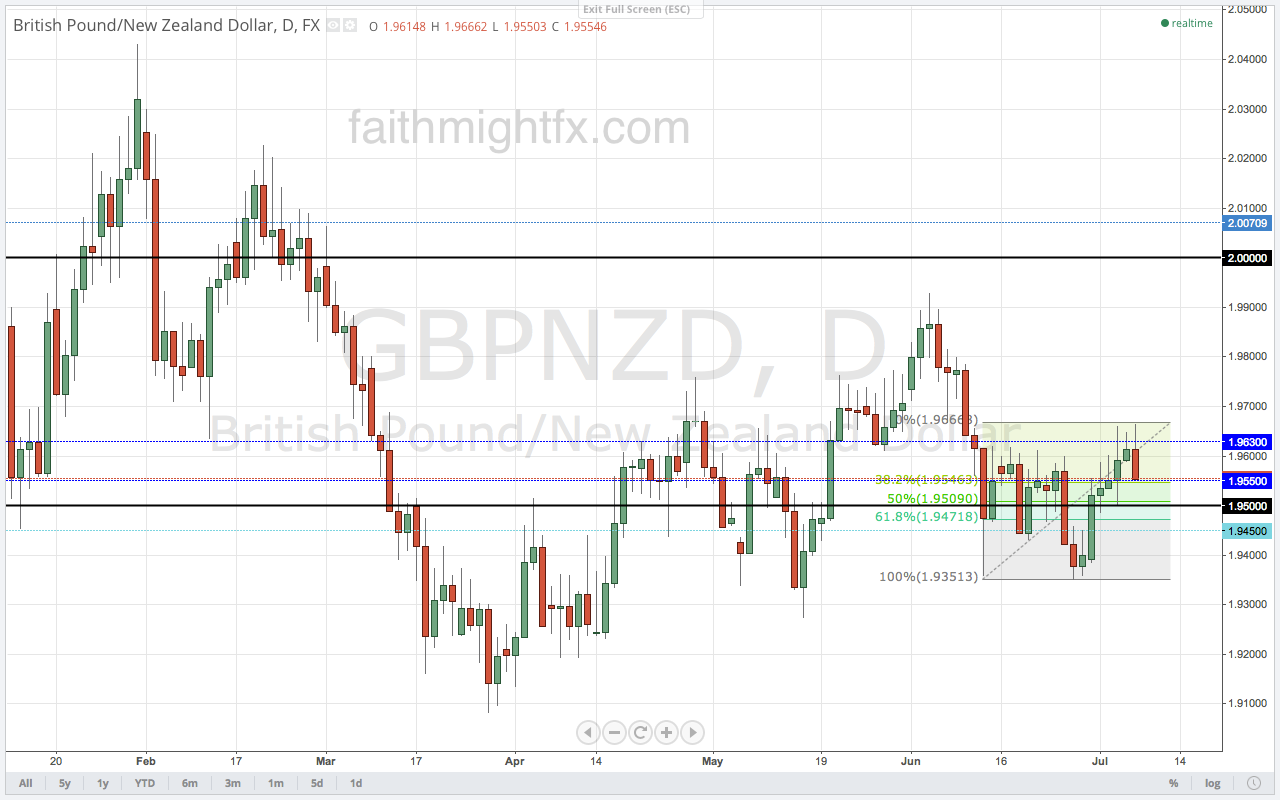
Last week was a seemingly anti-climatic week. The $GBPUSD had wild swings in both directions only to really have gone nowhere. It ended the week slightly lower. The $EURGBP has broken lower but no follow through yet. $GBPJPY is also lower after it failed to make a new high after its correction but no new lows. The $GBPNZD broke its range to the upside only to be capped by the larger 1.9750 resistance level.
As the new trading week opens, sterling is on the back foot. Last week’s lackluster was indecision and the market can only remain “stuck” for so long. Something has to give and something always does. But GBP is a mixed bag. While the rally in the $GBPUSD has given way to risk for a bigger sell-off, the $GBPNZD looks poised to move higher.
The $GBPJPY has also bounced nicely off the lows.
And the $EURGBP has become a battleground between $EURUSD weakness and $GBPUSD weakness.
The release of the Bank of England minutes, retail sales and Q2 GDP this week will either sink or boost sterling. If the minutes reveal any hawkish hints, particularly any votes for a rate hike, any chance for a correction are over. However, if the minutes turn out to be another non-event, retail sales and GDP become much more important. I think it would take a miss in both those releases to turn the tide on sterling. Watch the charts. Mind the calendar. Trade what you see.
Advancement in the GBP trend has stalled this week. Manufacturing and construction data missed this week and the Bank of England’s hold on monetary policy turned out to be a non-event. Sterling weakened briefly on the policy announcement but momentum never really took hold in either direction. Dips were bought but highs were also met with enough offers to keep price capped for another week. This stalling, sideways action is simply consolidation of the bull rally that has gained strength in the past month. Now as the 1st full week of trading of the 3rd quarter comes to a close, sterling remains in a tight range. Despite the tepid price action this week, sterling remains fundamentally strong. Between the US Federal Reserve and the European Central Bank, the BoE looks tremendously hawkish. Until that contrast changes, it is enough to keep sterling supported long term.
It’s nice when a trading session goes according to plan. Retracement levels were tested yesterday as sterling consolidates recent gains ahead of Thursday’s Bank of England announcement. We started the week with these charts. We staked out our levels. But it is not enough to make a plan. You have to have some conviction to put your orders on too. It doesn’t pay, if you don’t play. Position-sizing is a very underappreciated skill. It takes more discipline than you would imagine to establish a position in the market with the correct size. Too big a position and the risk may take you out before you can earn the reward. Too small a position and the reward just isn’t as satisfying for your account balance. I find that by scaling into a position, you can spread the market risk across multiple, smaller trades maximizing the best price the market is giving. Once we determine our position, the hardest part of executing any plan is the action of inaction – we wait.
We didn’t have to wait long. Thanks in part to lower-than-expected manufacturing and industrial production releases, GBP fell across the board yesterday. Days like yesterday, you don’t have to do anything. Just watch price. In fact, if you are planning each trade and trading each plan, you should experience more days where you are simply watching price move at the market’s will. When it’s too tempting to watch price action, leave the screens or risk trading carelessly.
After yesterday, we are headed into FOMC with all the charts still in play. $GBPNZD breached its Fibonacci levels so only support at 1.9350 matters to the downside on more consolidation. All other charts ($GBPUSD, $EURGBP, $GBPJPY) stand. Markets will be light and choppy waiting for the 2pm EST release time. Be aware that some market participants will take advantage of lighter flows and size up their positions. When central banks come to the stage, it is the larger timeframes that really keep you focused on true supply and demand in the market.
don’t get chopped up in low liquidity wheeling and dealing … focus on the bigger picture
Our first full week of the new quarter and we are greeted to a correction in GBP across the board. With the Bank of England rate decision this Thursday, price action today indicates tons of positioning as market participants take profits and set orders ahead of the announcement.
After rallying all week to new highs at 1.7176, $GBPUSD is using the weaker-than-expected Services PMI number this morning the excuse it needs to put in a correction. But don’t be quick to call cable bearish. Nothing moves in a straight line forever and retracements are great to keep a trend healthily intact. Corrections allow new positions into the market as those who missed this move will be looking to join the party. That new demand will only add more fuel to the rally allowing $GBPUSD to move to new highs. By working down the RSI reading, corrections indicate new strength can take us to new highs.
In light of the ECB press conference with Governor Draghi this morning, $EURGBP also has an opportunity to move higher on a correction too. A correction in this pair may give price the strength needed to finally crack the 0.7950 support zone that has stymied the decline in the $EURGBP for the past 2 weeks.
Big news day today. Don’t get caught up in the knee-jerk reactions. @50pips put it best earlier this morning,
heads up, should be a volatile rest of the day. no need to be a hero, focus on setups and don’t be the one chasing the moves… — 50 Pips (@50Pips) July 3, 2014
Sure, $GBPUSD has been rallying for almost a full year now. It has surmounted key psychological levels at 1.60, 1.6250, 1.63, 1.65 and 1.6750 and now the almighty 1.70. When cable closed last week at 1.7027 above the previous highs (1.6996), it was bullish. When the markets were fully open in Monday’s trading session, price surged higher. Though the rally on Monday was mostly explained by month-end and quarter-end fix flows, I had this to say
$GBPUSD wow. If data supports this wk, 1.7250 will not be that far off or crazy of a next target for bulls
And, in fact, the data has supported. Today’s data makes a case that not only has manufacturing picked up but is starting to really go strong. Markets like manufacturing so this data looks really good for sterling. And also puts more pressure on the Bank of England to raise rates earlier than they may want. Bullish fundamentals like this will continue to reinforce this strong bull run in $GBPUSD.
Green line is current price. Simple support and resistance.
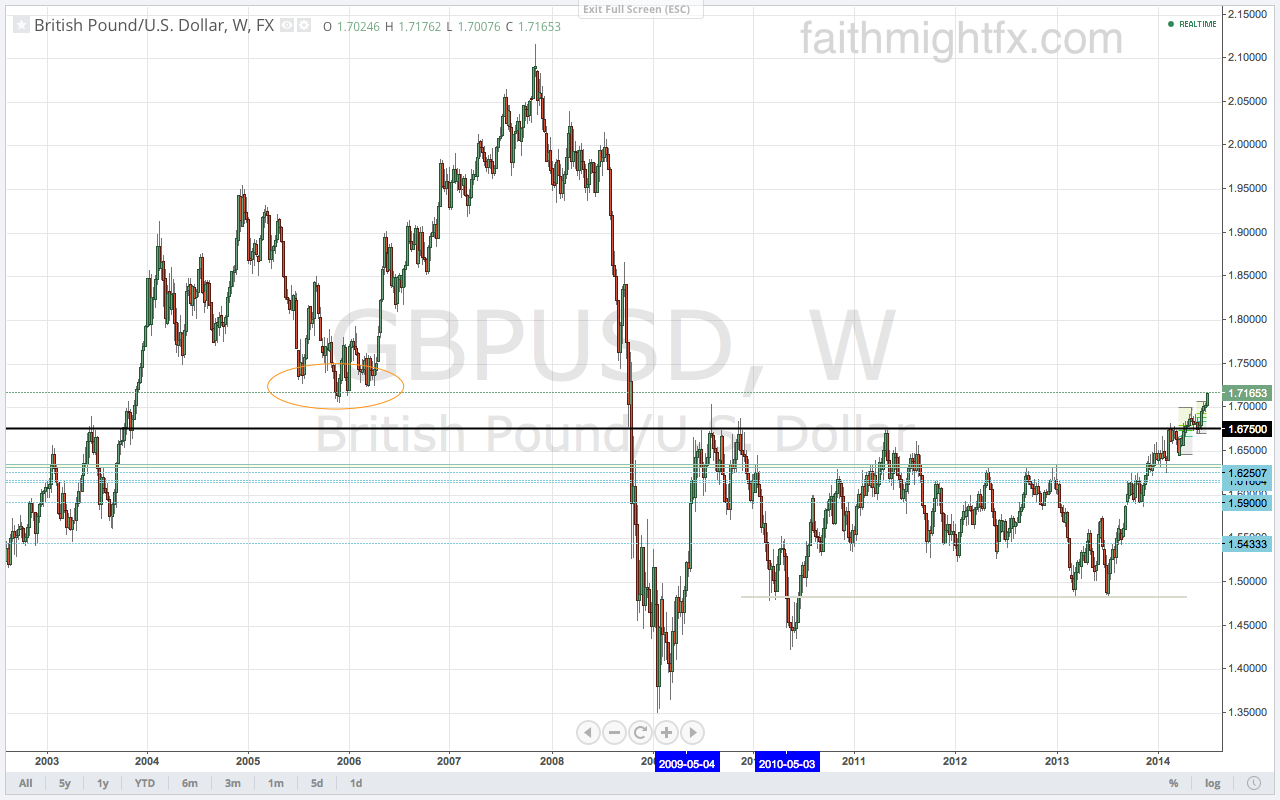
But despite fundamentals, always pay attention to price. Price is banging right up against former lows from (waaay) back in 2005-2006. With the short holiday week, cable may have peaked. Or price could run higher. She can and will do whatever she wants. For many traders who set up before this week, this is and should be a no-risk trade. But as we know, there is no no-risk in the markets. Trade what you see.