In the year 2018, $WMT share price has been stable for the most part with a few volatile moments occurring in price movement. The all-time high of $WMT was in January when price was at level 109.79. Price had dropped since then to around 81.82 which stands as a major support level for the year. Unlike other stocks in October, $WMT broke out of a ranging market to begin an uptrend. Before the upward breakout in October, there was a bullish signal in August.
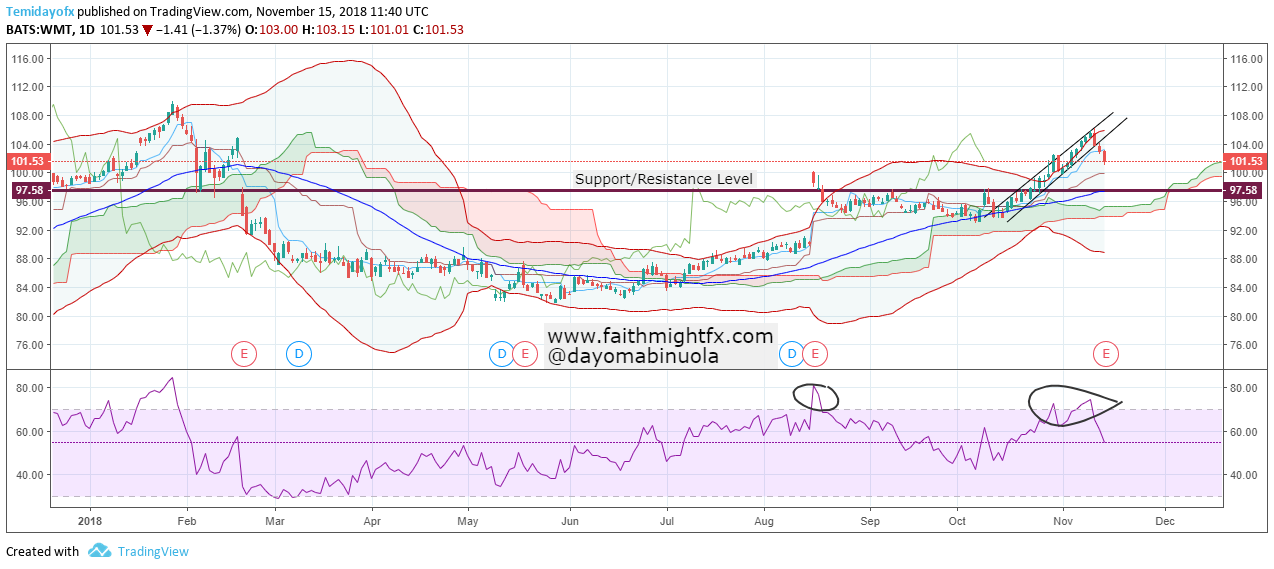
The RSI on the daily chart showed an initially overbought position and now in November, showing another overbought position. Since price crossed over to the upper region of the Bollinger band in June, it is yet to cross to the lower region. In the early days of October, price touched in the middle line of the Bollinger bands. If the support level is broken, it might trigger a major sell off for $WMT stock. The bearish movement might reach 88.94 from 101.33. Indications show a strong bearish movement might occur. For now, we will wait to see what price will do.