The Exxon Mobil shares in 2018 has been of low volatility with several higher lows and lower highs. Price of $XOM had initially broken support in February leading to a fall in price. The highest point of $XOM price in 2018 was at 89.32 which was in February; then the bearish movement made price to reach 72.71, the lowest level in the year. The highest rate of volatility of $XOM shares was in the first quarter of the year. Price action shows a long range in price from April to mid September. Both the bullish and bearish movement within the range period were between 700points. The second resistance level in the year, 87.51 was only reached once in September after a bullish movement broke out from the range.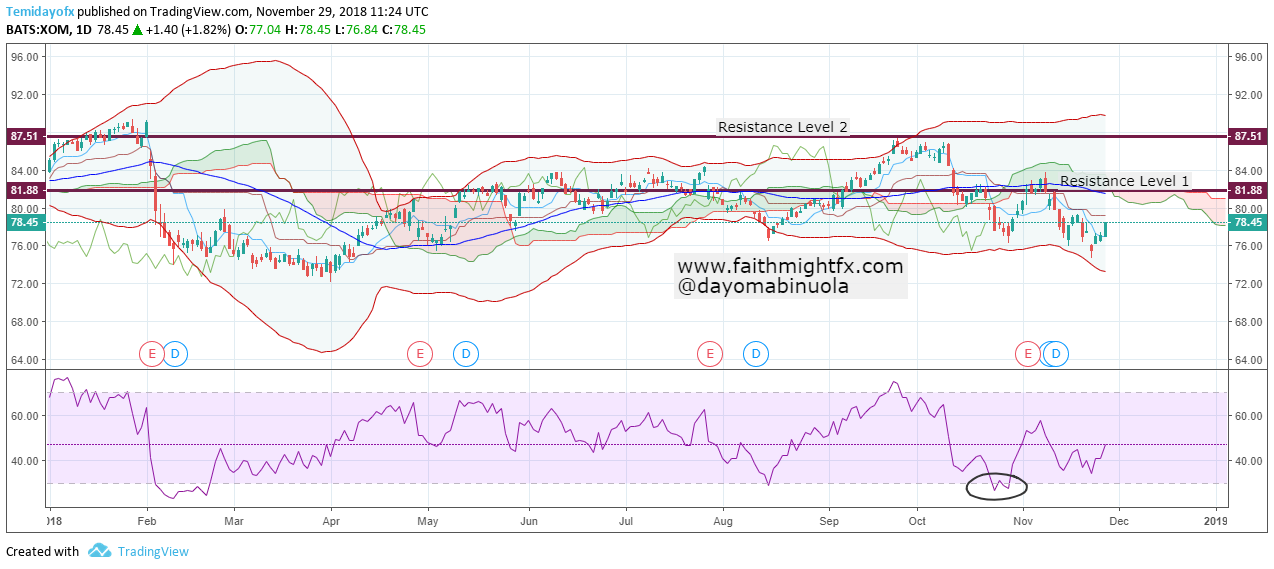
In September, when the price of $XOM reached an overbought position on the RSI, a reversal began. This reversal gave rise to price breaking the support level at 81.88. Price has since then been in the lower region of the Bollinger band. Price tried to retest back to the middle Bollinger band line which also stands as the resistance level. Price of $XOM is currently at 78.45, showing a trace of a bullish movement from the last 3 trading days. A breakout of the resistance level 1 at 81.88 could lead to a continuous bullish movement which might eventually reach 87.51. Investors might decide to go long on the $XOM since price is around a major support level in the year.