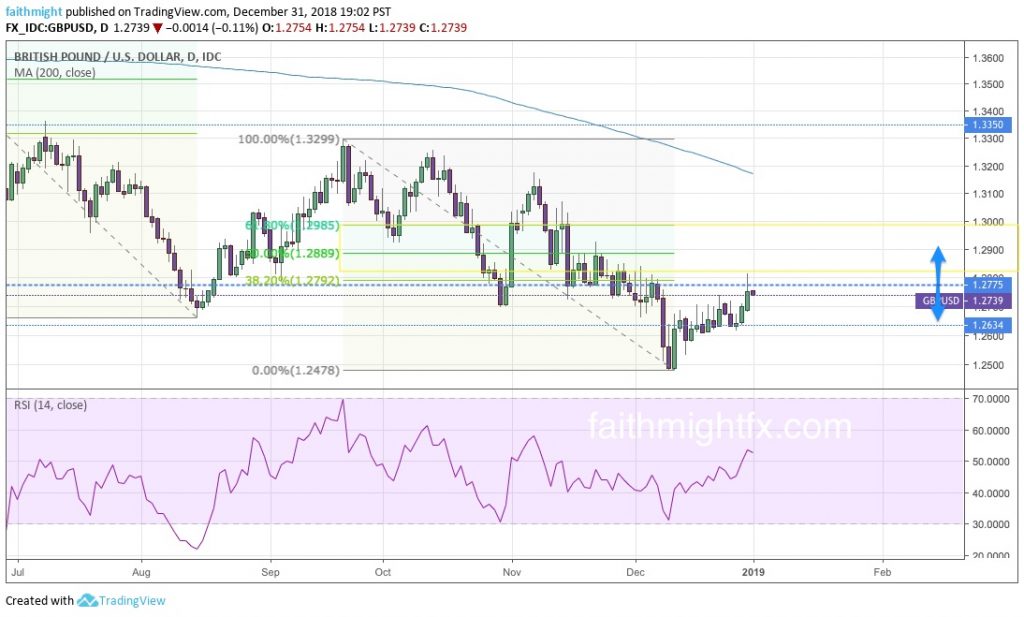
Despite today’s New Year’s Eve rally, sterling has closed 2018 at some of the lowest levels seen since 1985. That’s not insignificant. And given that we still have Brexit drama, the U.S. government shutdown, crashing equity markets and tightening monetary policy even if through unconventional means, 2019 is not shaping up to be a bullish year for sterling.
PREDICTION: The $GBPUSD will continue to rally to the 50% Fibonacci retracement level pictured above at 1.2889. Because the markets like to be cruel, I can see it moving even higher to the 61.8% Fibonacci level. At that level, so close to the major psychological level at 1.3000, bears start to turn bullish and major stops get tested. Just when it seems like sterling will really make a bullish reversal, it will plummet to make new lows at 1.2250. Later in the first quarter as the Brexit deadline approaches, the 2016 Brexit referendum lows at 1.1950 (depending on your broker) will be probed. The market’s reaction to the Brexit deal that does finally materialize will determine where we go from there.
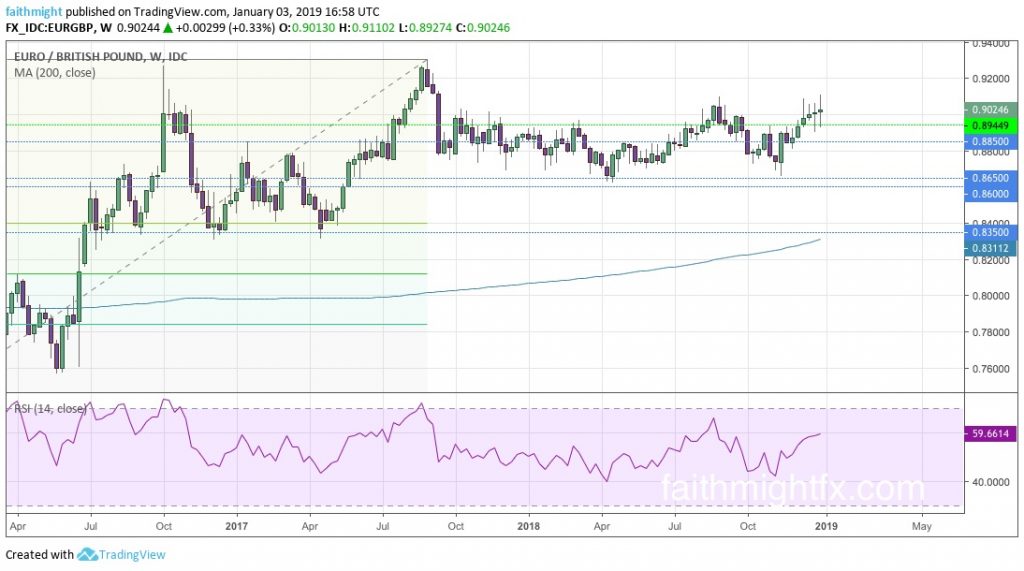
The euro celebrates 20 years this year! And its 20th birthday may be a good year for the euro, particularly against this GBP weakness. But the $EURGBP remains fairly rangebound to start the new year. In fact, it has been rangebound since late 2017 after reaching new highs at 0.9306. However, it is a bullish range as this sideways action for the past 2 years has never managed to move low enough into the Fibonacci retracement levels on the weekly chart.
PREDICTION: The $EURGBP continues to move higher. But it will be a grind and stair step higher as the markets contend with European politics in France, Italy and Great Britain. When the market finally resolves this 2-year long consolidation period, the $EURGBP will reach and break above the 0.9306 highs set back in 2017.
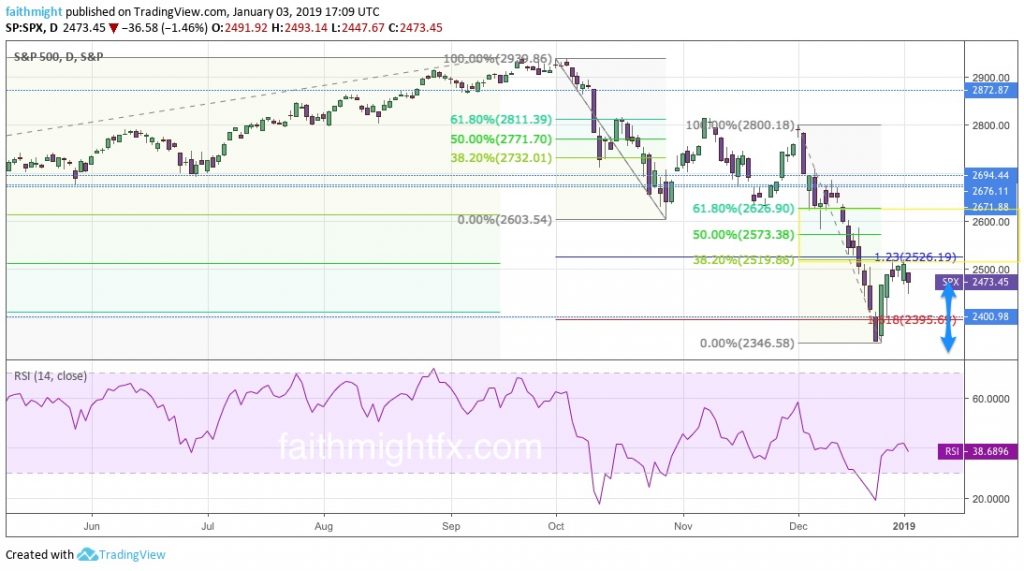
Equities rocked investors in 2018 when it did not deliver the Santa Claus rally that investors have come to rely on for the past 8 years. Instead, we were greeted with the worst Christmas stock market when the S&P closed down 2.71% on Christmas Eve falling to 2346. It was the worst Christmas Eve ever since 1985 when it fell 0.69%.
The 2400 level is a huge level in the S&P 500 ($SPX). This level marks the 2017 highs where price stalled, consolidated for a few months, and then barreled through that resistance to then new all-time highs. Those December lows mark a level of real support that I honestly have had my eye on since 2017. At that time, I expected a correction in price lower. Rather, it was a correction through time as bulls continued to buy the dips. This year, 2019, however, is a very different market.
PREDICTION: It seems any corrective bounce higher will remain below the lows at 2600. Above the 2600 level, equities may be ready to start a new bull market. But if it can’t hold above that level, I would look for $SPX to make new lows below the 2400 level. A break below the 2346 low sees price move to the 2132 support level.
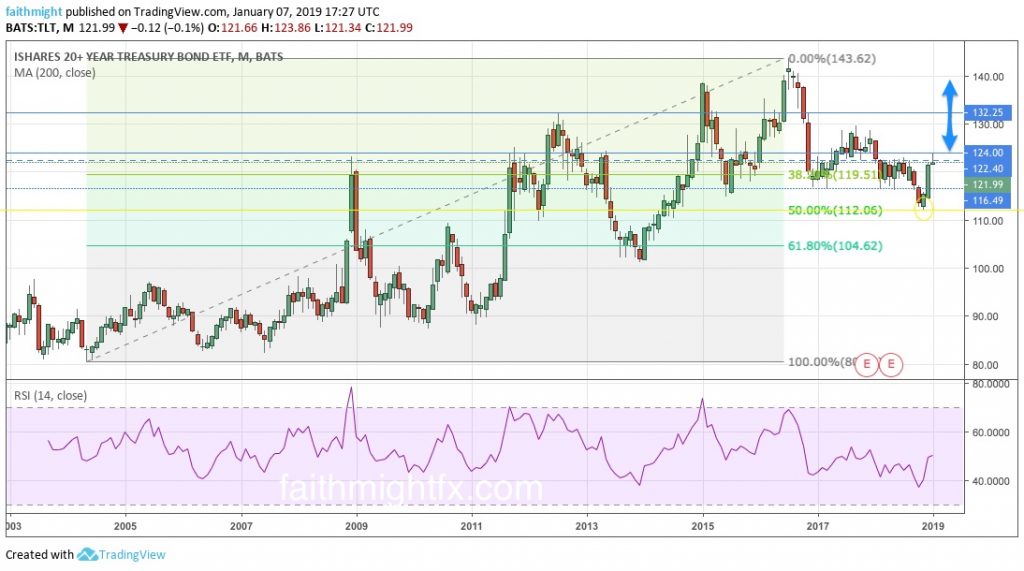
A discussion on stocks is just not complete without a mention of bonds. After peaking in 2016, $TLT plummeted just 2 months later. The $TLT was in a free fall right to the 116 support level where it consolidated before moving lower. Many cried that bonds were in a bear market and they would be right, looking on short to midterm timeframes. But on the monthly chart, $TLT was still in a correction (albeit a very deep correction). As such, the 2018 lows were very important. They marked the 50% Fibonacci retracement level on the monthly chart. It would have sparked mad capitulation had that level been breached.
PREDICTION: Now that price has moved back above the 116 support-turned-resistance level, $TLT looks well-supported to move much higher from current levels. I like a return to 130 in $TLT. A move above that psychological level clears the way to 132.25 where the market will have to make a decision. Depending on how investors are feeling about risk, price would need to hold above 132.25 for the bull move to continue higher and challenge the all-time highs at 140.13.
2018 was a year full of ups and downs. Nicely, most of those ups happened in my career. The downs last year really did make me stronger and propelled me in new directions that should be very good for the company and my career in 2019. Cheers to the new year! ?
Source: @cubewealth


One Reply to “My 2019 Outlook”