For over 6 months in 2018, the $IBM price pattern showed little volatility until the first week in October when the price fell from 154.48 to 114.26. After this fall tried to maintain support at that same level, a continued move lower started in December to the next support level at 107.66. The second support level at 107.66 serves as a stronger support because a bounce occurred. Since that time, $IBM share price has maintained an uptrend in 2019, with over 2000points before reaching an overbought position.
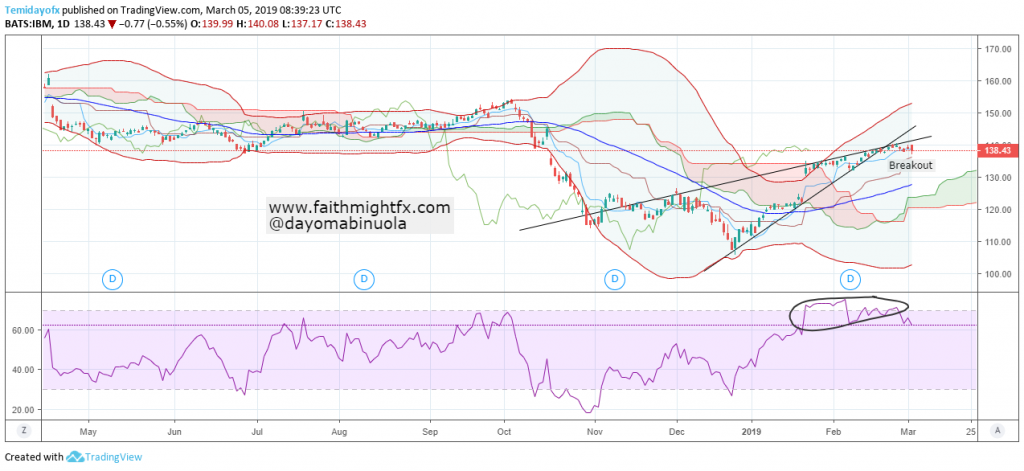
Price being undoubtedly overbought in the past few days is a likely signal for a reversal downwards. The trendlines have been broken downward and the bulls seem to be taking a break from the market. Despite the RSI showing an overbought region, the Ichimoku’s future shows strong bullish action still intact. On the 23rd of January, there was a gap upward which is yet to be filled. Though $IBM still maintains the upper region of the Bollinger bands, the bull power might begin to lose its momentum.