ETSY made its stock market debut on April 16, 2015, with an initial public offering of $16 per share. Etsy was able to sell 13.3 million shares at the time. Since the launch, ETSY has appreciated in value by about 15X. Put into real perspective, If $1million was invested in $ESTY in 2015, the current value should be over $14million.
ESTY has maintained a bullish run in the past 6years, reaching an all-time high at $252.53. However, Since the all-time was attained, the price has started to dip. A head and shoulder pattern has been formed between February and April of this year, which brought about a range between $190 and $252.
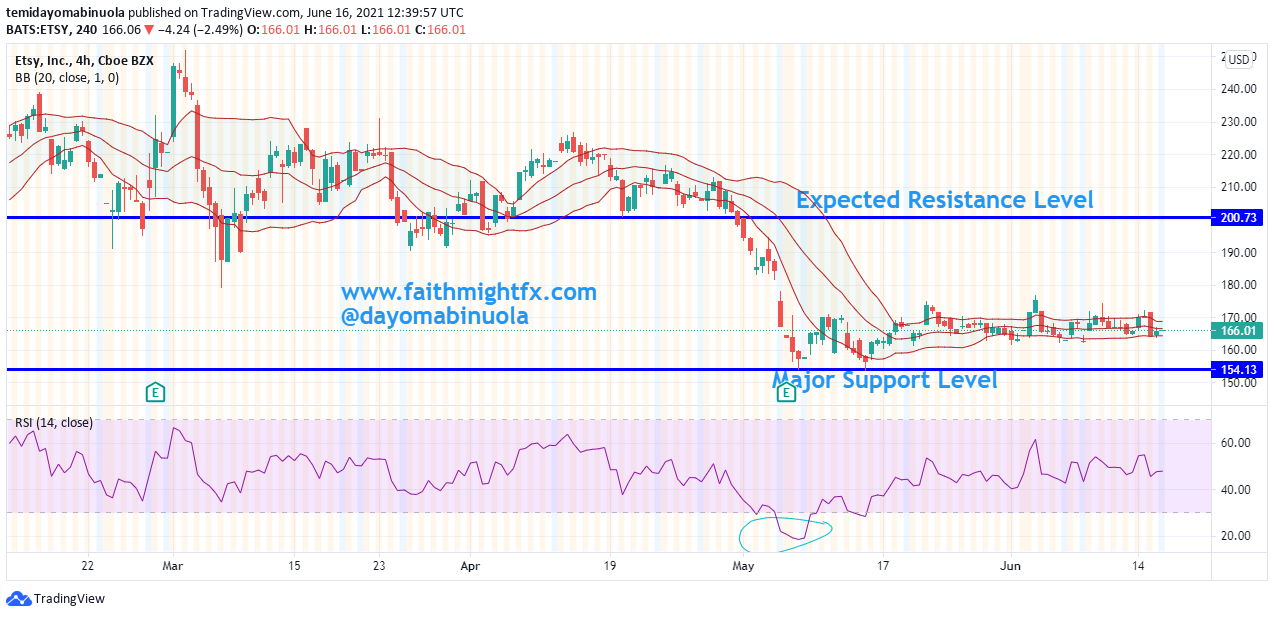
After the head and shoulder pattern has been formed, there came a dip which made the price reach $153. Since the price fell from an all-time high at $252, $ETSY has lost 39% of its share price. Since the beginning of May 2021, $ETSY price has been between $153.80 and $176.50. Indications show there would be a breakout soon. To the downside or to the upside? There are chances price might appreciate towards $200 in the coming weeks. Business Insider has opined that the next coming month might be bullish for $ETSY( ). Since the recent dip in price, RSI has signaled that the price has been oversold.