In July 2020, Tesla share price began a bullish movement from $322.61 to reach an all time high at $900 in January 2021. Price of $TSLA was in a range in January 2021 until the bearish movement started in the early trading days in February 2021. The dip from the all-time high at $900 brought price to $537.37 in March. A major support at $537.37 was reached due to the bearish movement. Not long after the price consolidation in March 2021, the $TSLA bulls started to push price higher, thereby creating higher lows and higher highs.
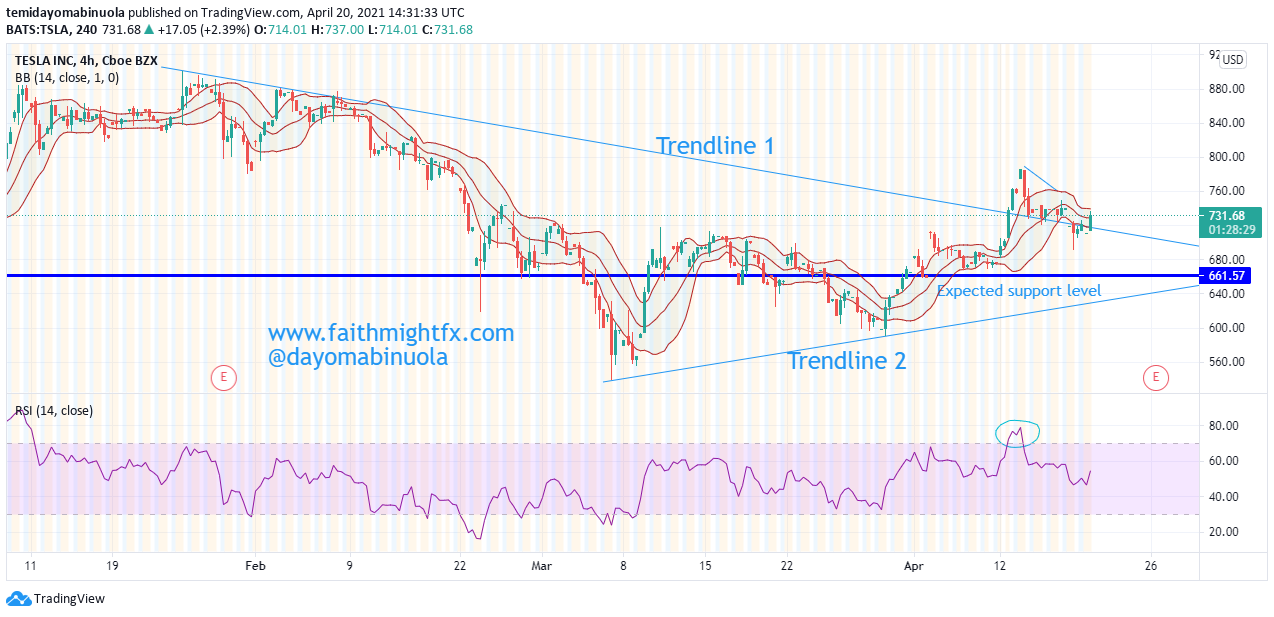
RSI indicates an overbought position on the 4hr time frame. Using the Trendline 1 and Trendline 2 for further analysis, price had to break the resistance level to the upside at $736.58 in Trendline 1, though the breakout could be a fake one. Trendline 2 is the support level after the dip which had support prices both at $539.57 and $600. The support level at $539.57 was the lowest price level $TSLA reached in 2021. Last week, there was an up-rise in the price of $TSLA, which made price of $TSLA to reach $780. There are other indications that could make the price of $TSLA fall to reach a new support level at $661.57. Buying $TSLA on a long term should be a good deal.