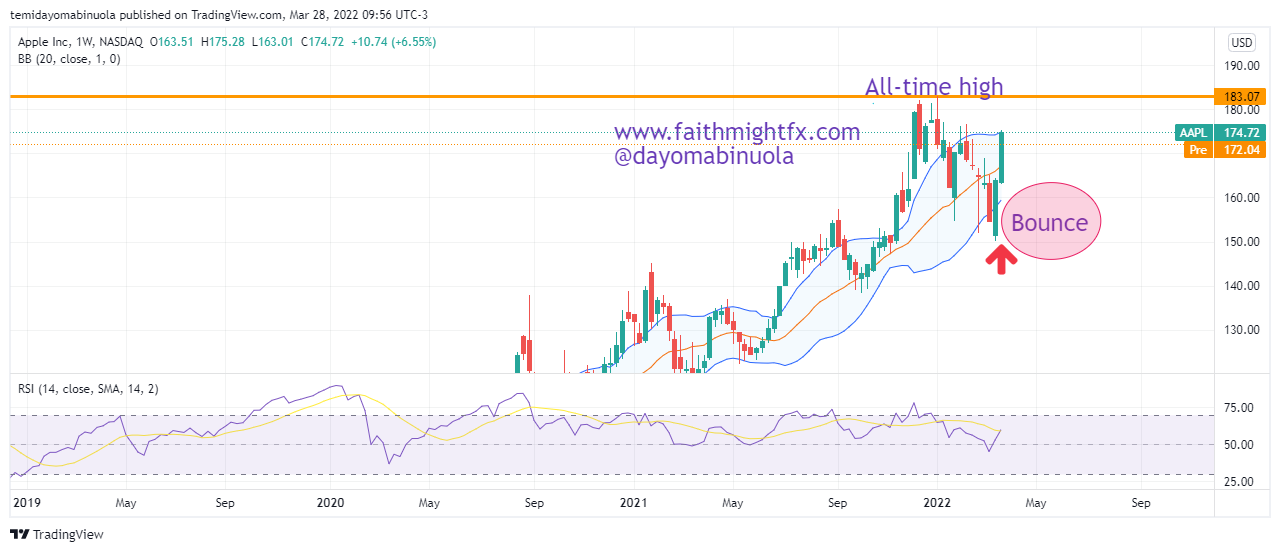
Apple hit a new all-time high of $182.93 on the 4th of January, 2022. Long-term Apple investors were able to benefit substantially from the new all-time high. The rally to the all-time high could not be sustained for long as the price of $AAPL slumped to a support level at $150.80. This could have been a result of the ongoing war between Russia and Ukraine; or the increase in inflation rate in the US. Over the last decade, $AAPL share price has been on a bullish run with few price corrections. Late into January and the whole of February 2022, there was a correction in Apple’s share price but this dip did not terminate the bullish streak.
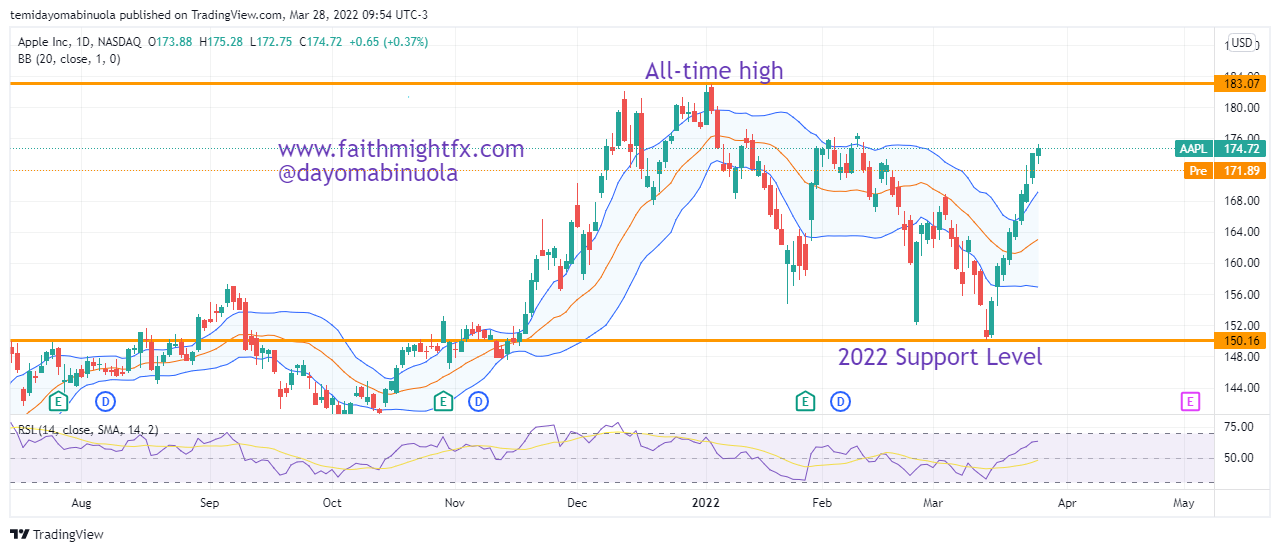
Since mid-March 2022, the $AAPL bulls began to push price higher after an inverted hammer was formed on the 14th of March, 2022. The price of $AAPL closed at $149.66 on the day the inverted hammer was formed. The second and third week of March 2022 have shown that the bulls are about to push the price to a new all-time high in the next quarter. On the week of the 26th of March, $AAPL closed at $174.72, which was over a $25 increase in the price of Apple shares. This recent bullish trend is giving investors confidence in Apple as they hope that the price continues its rally.
Some of these ideas are in our clients’ portfolios. To understand if this one can work for you or for help to invest your own wealth, talk to our advisors at FM Capital Group. Would you like more information on how to get stocks in your portfolio? Schedule a meeting with us here.