fbpx

Boeing’s Share Price Consolidates

The share price of Boeing opened at $209.91 at the beginning of this year. Price rallied to $272.98 on the 15th of March, 2021, which makes it the highest level $BA reached since the pandemic began. In 2019, Boeing’s share price reached an all-time high at $445.62. After the all-time high was reached, a head and shoulder was formed, which resulted in a dip to the lowest level at $90.29, which was during the pandemic. The current price of Boeing is at $214.34, which is almost falling to the year’s opening price at $209.91.
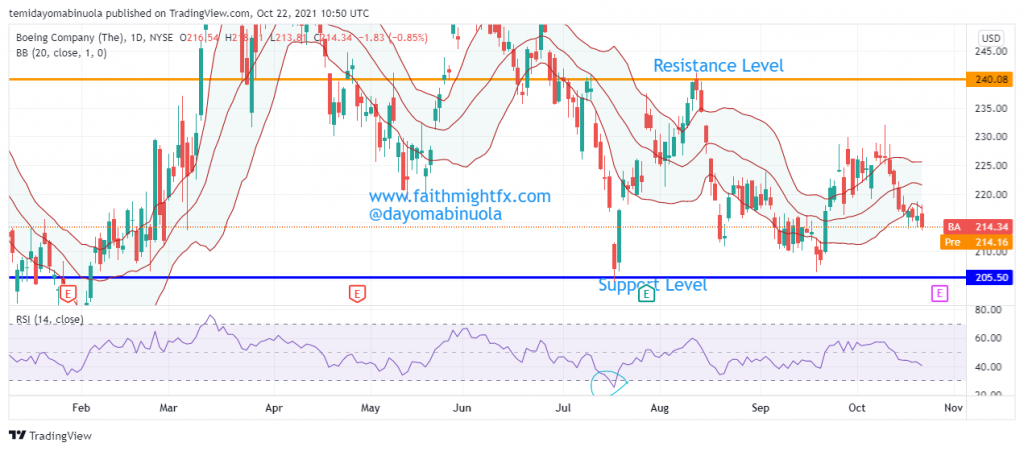
RSI showed that the price has been oversold in July 2021 at the support level of $205.50. After the dip in July, a rally occurred temporarily, the price has been consolidating around the support level since the second half of this year. The price of $BA has not really favored investors in this month of October as the price has been falling continuously. Consolidation of price is around $214.34 which could lead to the next rally towards $230. As countries across the world increase the administration of vaccines, there might be a huge rally, which is as a result of an increase in international flights globally, which might break the resistance level at $240.08 to the upside.

EURJPY Price Failed To Touch The Previous Resistance Level

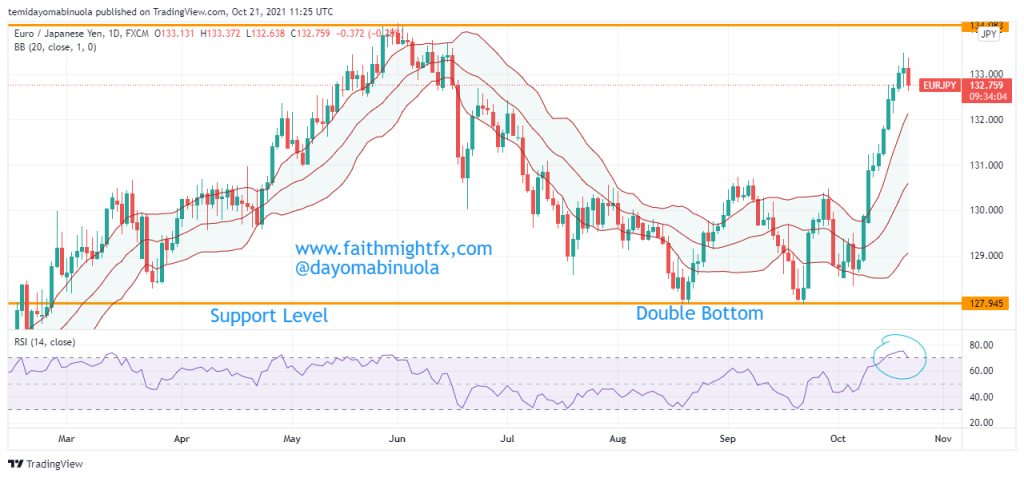
$EURJPY’s price at the beginning of the year was 126.046 and the price was able to reach the highest level at 134.083 in June 2021. A double bottom has been formed between the months of August and September of this year. This double bottom activated the rally of $EURJPY with the current price at 132.618, 350 pips less of the previous major resistance level at 137.545, which was last seen in February 2018. The highest price of $EURJPY in the last decade was at 149.838. The Euro seems to appreciate more against the yen since the lockdown. Nevertheless, Japan and many countries have vaccinated more than 50% of their population. 

In recent times, there has been an increase in the demand for labour and skill in Europe. This was as a result of the lockdown, as many foreign skilled people are relocating to Europe. Before the dip in August and September of this year, which resulted in a double bottom, RSI showed that the price has been overbought in May 2021. At the moment, the price is already overbought on the daily chart. This could lead to a possible reversal in price as a Doji was formed yesterday and today’s candlestick shows a bearish one. If the price closes with a bearish candlestick and the next few days close on a bearish note, the price might fall to 129.261.

Gold And Silver Prices Are Increasing

Exactly a month ago, an article was written to show the likely possibilities of an increase in the prices of Gold or Silver. Since August 2020, Gold’s price has been on a downward slope from the all-time high of $2076.74. Despite normalcy is almost returned to the world at large with the mass vaccination introduced, prices of Gold and Silver have had lower highs and lower lows in the last year.

For silver, the price reached a new high this year $30.06 per ounce. The last time one ounce of silver cost $30.06 was in December 2012. The demand for metals has increased in the last few years, as more luxury items, gadgets, and equipment are produced globally. Everyone who must have bought gold or silver on the 14th of August 2021 when we wrote the article, must have gained a reasonable amount in their investments.

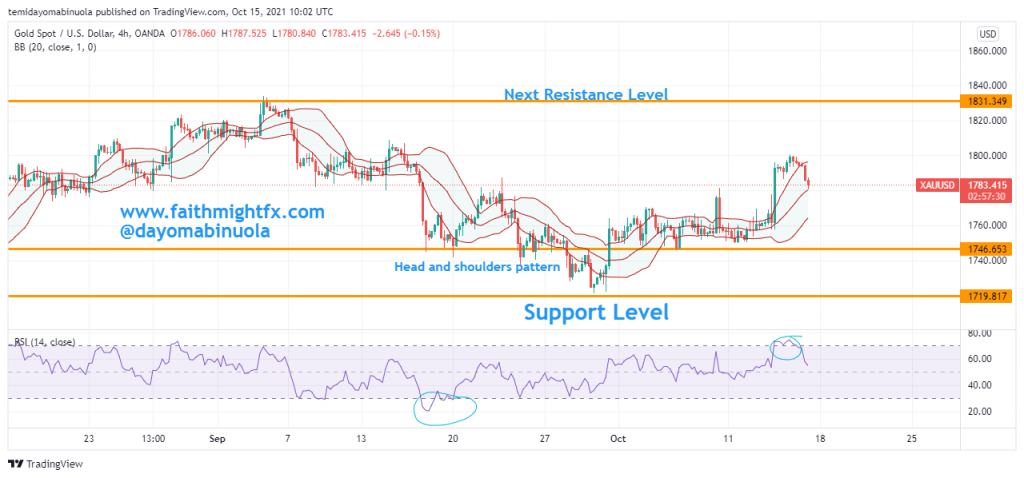
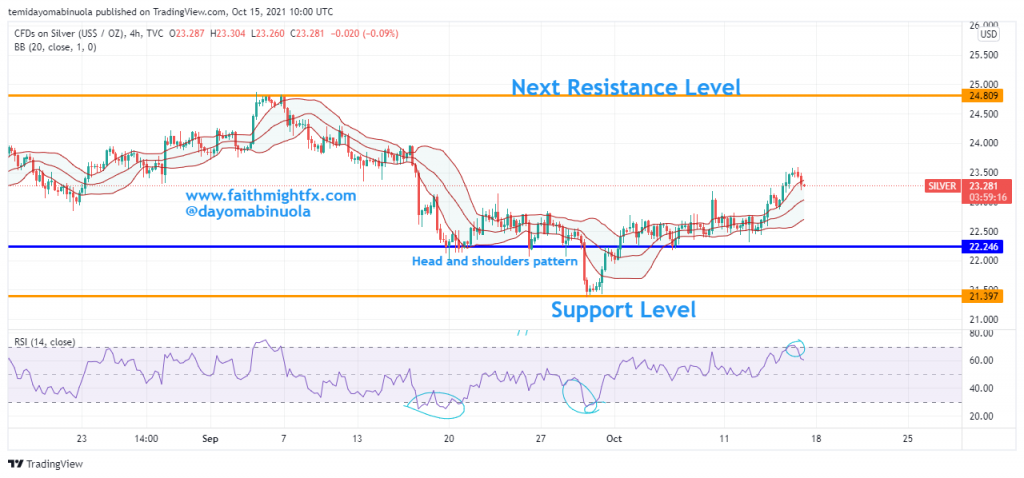
Both Gold and silver charts have formed an inverse head and shoulders pattern. This could be a strong indication of a bullish run for both metals. The next bullish run could push the price of Gold to $1837 per ounce and that of Silver to $24.809. In September, both Gold and Silver prices had a bull run but could not break the resistance level at $1837 and $24.809 respectively. 

The Dangers of Bull-Traps and Bear-Traps

A bull-trap is a false signal that shows a decreasing trend in a stock, currency, index, or other financial instrument has reversed and is now heading upwards, when in fact, the value of the security will continue to fall. Traders or investors that acted on the buy signal generates losses on resulting long positions.

A bear-trap on the other hand is a technical pattern that occurs when the performance of a stock, index or other financial instruments incorrectly signals a reversal of a rising price trend. The trap is thus a false reversal of a declining price trend.

Many traders especially lose money after being caught up in traps. Many investors have lost huge funds in traps. Traps sometimes might take months or years if a reversal occurs at all. Traps affect the mental health of traders and investors.

Avoiding Traps In Trading

  1. Practise risk management
  2. Never ignore the long-time patterns before making entries.
  3. Don’t try to be too early, no one awards you for being the first trader.
  4. Never get into a trade when market squeezes.
  5. Don’t trade the initial breakout, watch out for the next few candlesticks to confirm.
  6. Trade in the direction of the main trend

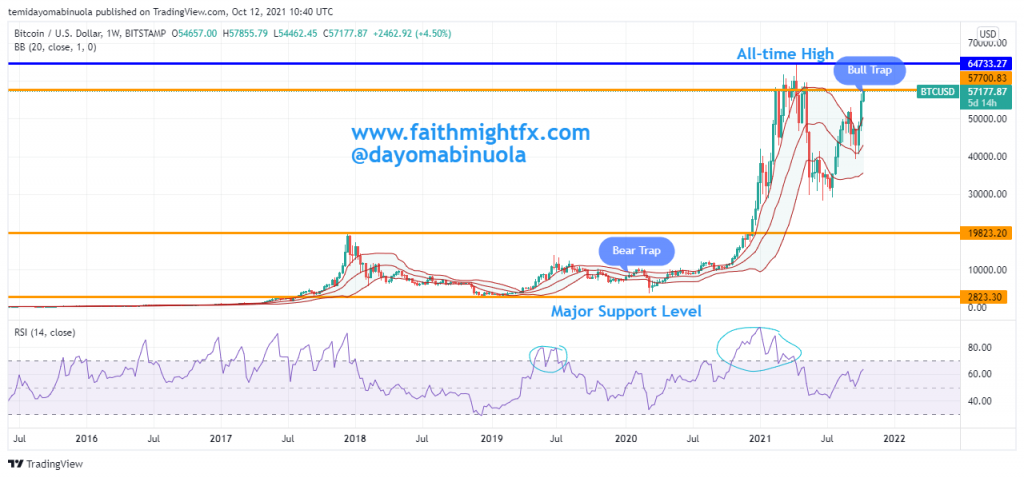
Taking a look at the BTC chart. In December 2020, the bulls broke out the initial resistance level in 2017 at $19,700. Ever since this breakout occurred, the price is yet to reverse. The closest reversal occurred in June 2021 when the price reached $28,300. I want to believe most BTC bears who shorted BTC in December 2020 must have been liquidated.

Also, the bulls reached a new all-time high in April 2021 at $64,700. Price reversed to $28,300 in June 2021. The bulls are back into more action as the price is currently at $57,200. Between February and May 2021, each time price opens above $57,000, it never closes above the $57,000. Traders and investors who invested above $57,000 must have been trapped. If the price reaches an all-time high, it ceases to be a bull trap.

Facebook Share Price Broke The Support Level

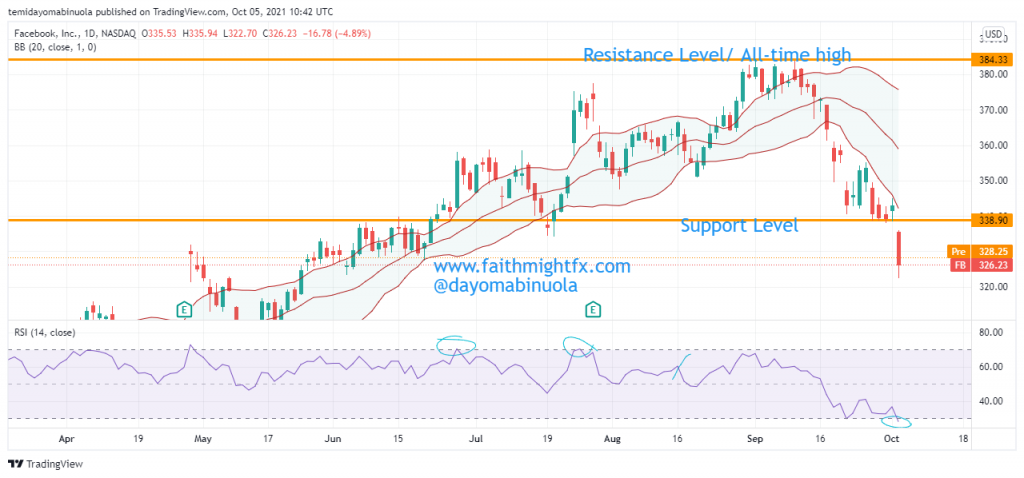
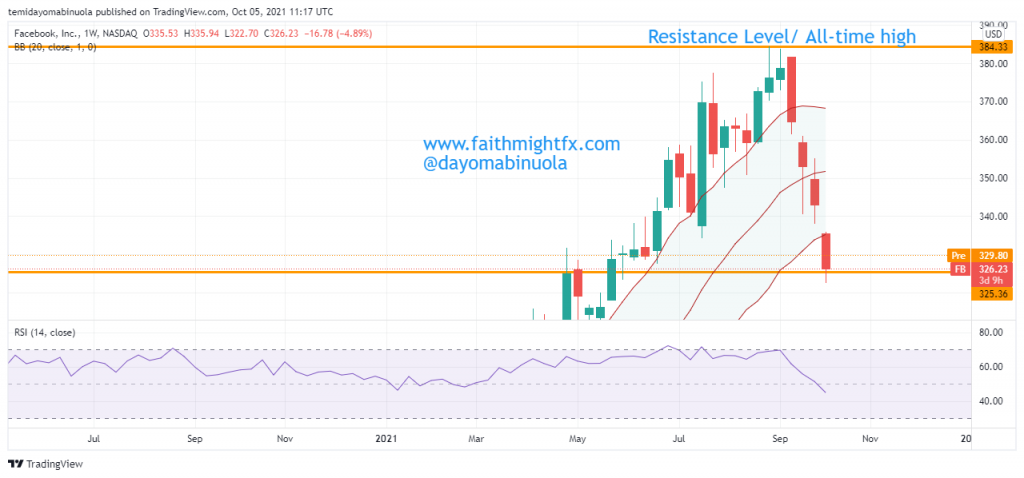
The Facebook share price has been enjoying a smooth ride as the bulls were able to take the price to an all-time high in September. After the all-time high was reached at $384.33, the price fell to $338.90. For the past 4 trading days, the price has been consolidating around the support level at $338.90, but the unusual happened yesterday as there was an outage. This outage affected the three-platform owned by Mark Zuckerberg i.e. Whatsapp, Facebook, and Instagram for about 6hours. Bloomberg gathered that the global service outage that kept its social media apps offline for much of Monday on a problem with its network configuration, adding that it found no evidence that user data was compromised during the downtime. 

The $FB market opens at $335.75 yesterday and the price went as low as $322.25, but the market closed at $326.23. There is a rise in the pre-market price as the price is currently at $328.25. Taking a looking a weekly chart, the price was already overbought on the RSI, the outage only brought about a correction in price. The last 3 trading weeks show the price of $FB has been falling prior to the outage. A gap down occurred at the end of the second trading week in September, price is yet to retrace to the gap down. Also, yesterday’s opening price was after a gap down. Investors should be hopeful, as the price could retrace in the coming weeks to the second, then the first gap down.

The share price of $FB is currently at the lower region of the Bollinger bands. As normalcy is restored to the various platforms owned by Facebook Inc, we hope the price of $FB will begin to rise.

Facebook Share Price Dips

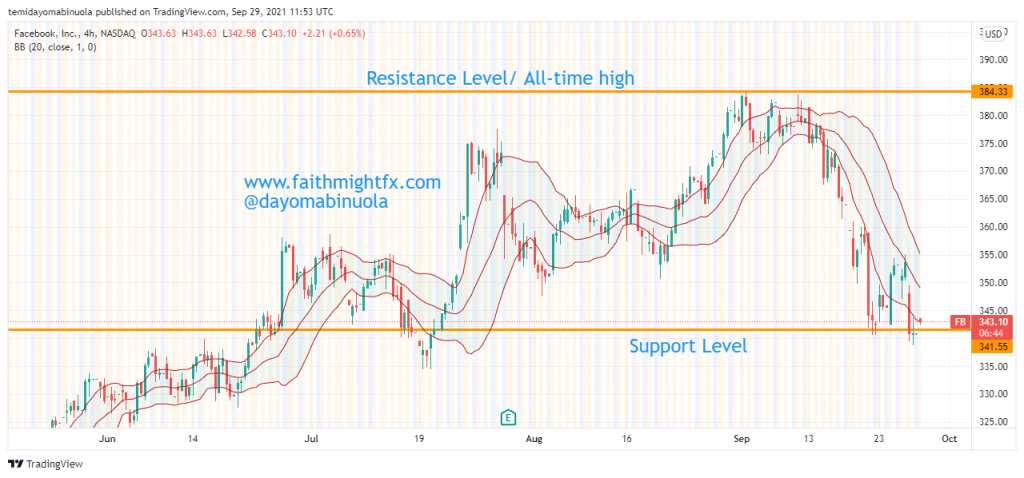
Facebook is an American online and social media and social networking service owned by Facebook Inc. In Facebook’s 17years of launch, the social networking site has about 2.85billion users as of 31st March 2021. $FB’s investors have had a rewarding year as the opening price was at $259.20. The price was able to reach $384.33 this September before a correction began. The correction has pushed the price lower to $340.65 at the close of the market yesterday. After the price reached a new all-time in June 2021 at $341.74, $FB share price has continued to rally. The new support level is around $341. The bears were able to push the price lower in July, but it was a fake-out of support at $341.

Despite RSI showing that the price has been overbought at three different times on the 4hr chart, there was an oversold indication in the past few days. The candlesticks still maintain the lower region of the Bollinger bands. There are tendencies the bulls might become very active soon, thereby appreciating the price of $FB. Since the acquisition of Whatsapp in 2014, Facebook has increased its price by a 5X growth rate. Also, price appreciated furthermore after the dark mode was launched on mobile devices. The share price might be boosted as Facebook expands the metaverse initiative with $50million.

EURJPY, A Pair With A Double Bottom

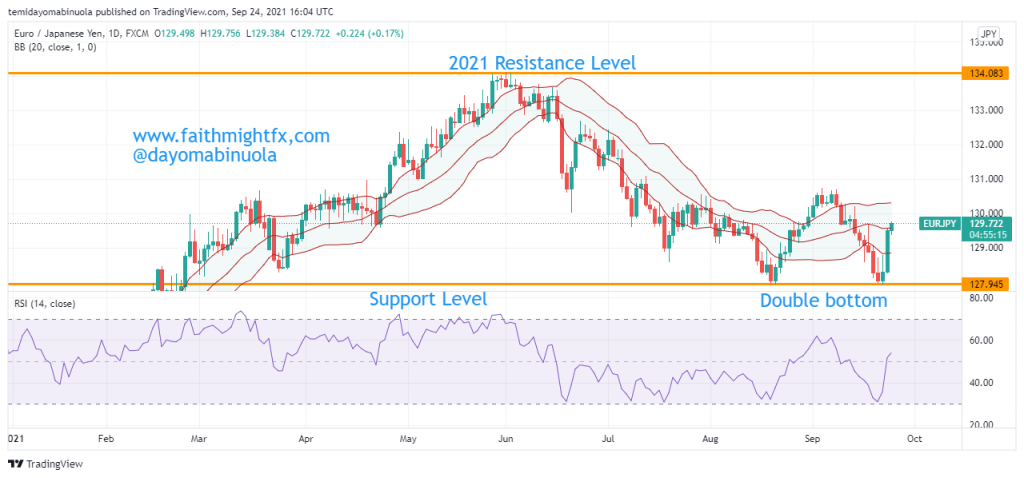
The year 2020 was good for the EURJPY bulls after the price opened at $121.92 and closed at $126.11. . Taking a further look at $EURJPY, the first half of this year was full of higher highs and higher lows till June. The bears took charge of the EURJPY pair after the highest level in the year was reached on the 1st of June, at $134.09 when the price began the downward trend.  

The 4hr chart has shown multiple oversold positions, which could be an indication of a possible rally. There is a likelihood $EURJPY reaches $130.58 in the coming weeks as last week’s candlestick was bullish. A double bottom has been formed at $127.90 in the month of August and September. As the price is currently at $129.64, we should be seeing price movement towards the psychological level at $130.00 next week. News released shows Sweden producer price index surged in August by 1.8%; the Italian consumer confidence improved in September as of today.  These could be the reasons the EUR has been appreciating against the YEN.

GBP Is Beginning To Gain Against The USD

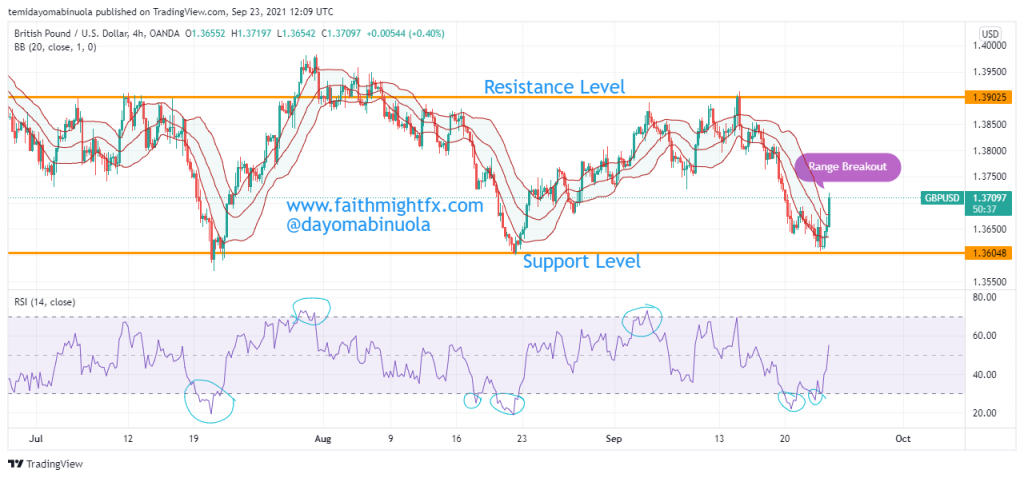
GBPUSD has crossed to the bull region since the lockdown in 2020, making the GBP gain against the USD. The appreciation has led to a new high at 1.42634 since 2018. The lowest price of $GBPUSD at 1.14242 was reached during the lockdown. The monthly chart shows the pounds a W pattern is about to be formed, which indicates a continued bullish movement. In the last 3 months, $GBPUSD has maintained a support level of $1.36048 at three different times. Price could not break the support to the downside. The GBP might be appreciating against the USD for the new few years.

RSI shows price has been oversold 5 times in the past 3 months and overbought at two different instances. The $GBPUSD bulls are willing to push higher. Last week, the price has been ranging around 1.39611 and 1.36048, but a breakout just occurred.  This breakout might follow a similar pattern it has followed in July and August. If the price fails to break out the resistance level at 1.39025, then a correction might occur. But as it stands, a breakout is likely to occur, as the price has crossed to the higher region of the Bollinger bands. If the price closes in the upper region of the Bollinger bands, the bullish movement might continue.

Boeing Ready for A Rebound

After the lockdown made the airline industry lose billions of dollars as a result of planes being grounded, the ease of lockdown gave up to the airline industry as jobs were restored and the tourism industry try to regain its balance. Also, the Boeing 737 max was grounded worldwide between March 2019 and December 2020. This was a result of the two crashes that claimed 346 lives. The Boeing 737 Max was recalled across the world due to a series of failures. The tourism industry has been badly affected by the pandemic, but hope might be rising as vaccines are being administered across the world.

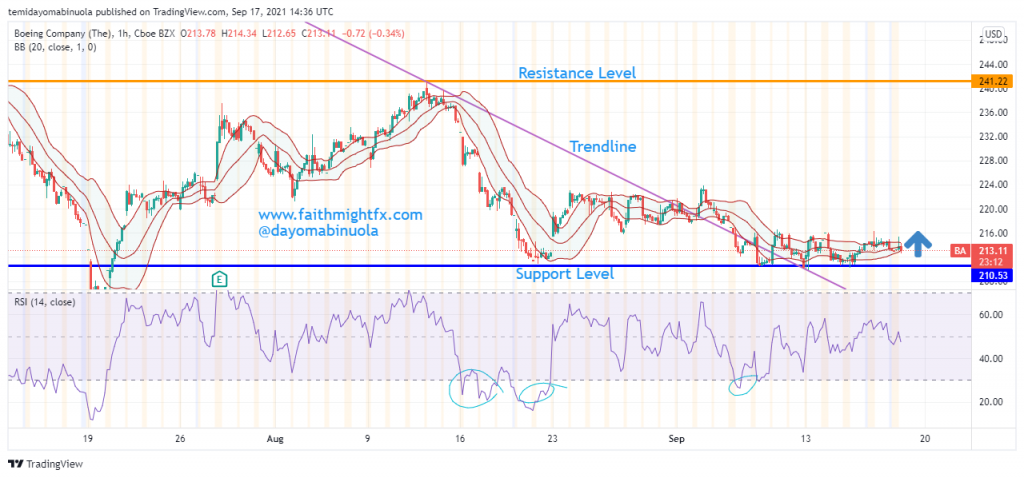
Since the ease of lockdown, the $BA daily chart has been showing higher lows and higher highs. As the price is currently at $212.14, we expect a bounce. We are hopeful the price will appreciate in the coming weeks as Boeing delivers 22 jets in August, 737 MAX ‘white tails’ nearly gone (yahoo.com). RSI has continuously shown that the price has been oversold in the past few days. A $BA price rally above $234.90 could occur, as the trendline has been broken to the upside. Also, the company claims that Boeing’s Aircraft Demand Forecast Bullish Despite Short-Term Headwinds (yahoo.com), as the press release, shows the demand for 19,000 new commercial aircraft with a book value of $3.2trillion over the next 10years.

FedEx is currently on a downtrend

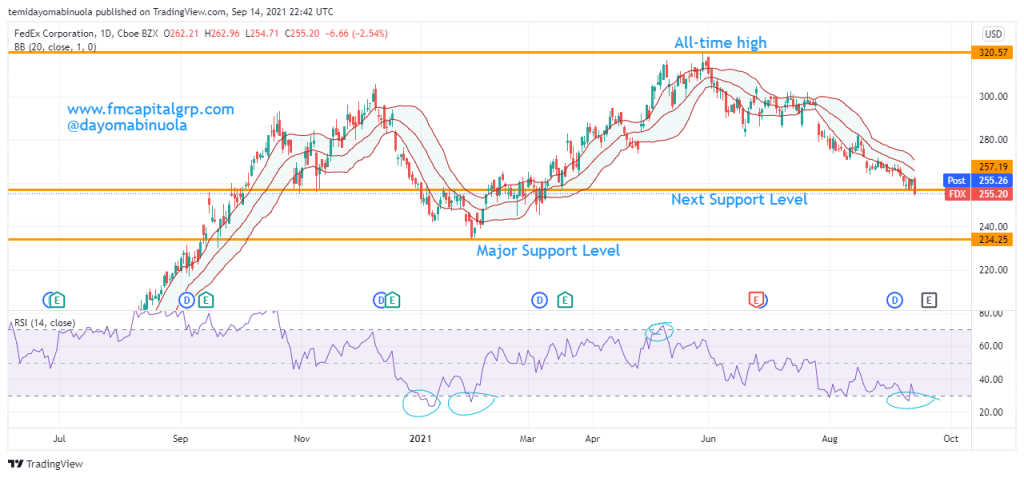
This year started well for FEDEX investors as prices rallied from $260.01 to $320.57. A ‘head and shoulder’ was formed between January and February of this year before the bull run to the all-time high was reached. Another indication was shown in January as there were two oversold spots, which later led to the bull run to the all-time high at $320.57. After the all-time high was reached, the price reversed to the downside, to reach $255.20, which was the next support level. There was little price movement in the share price of $FDX in 2019 at prices ranged between $139 and $199. The investors must have had a huge relief as the share price of FEDEX began to go to the upside, which eventually pushed the price to the previous all-time high in 2018 at $274.49. 

The earning reports for FDX will be released in about a week. As FedEx, Salesforce Collaborate On E-Commerce, Supply Chain Management (yahoo.com), this might lead to the next bull run of $FDX. Just as this writer doubts the next bull run, FedEx (FDX) Earnings Expected to Grow: Should You Buy? (entrepreneur.com). We are anticipating a bull run as the earnings report is released on the 21st of September, 2021. $FDX has been on a losing streak in the past few weeks. The second half of this year has not been favorable for $FDX investors as there has been a huge sell-off. The next bull run of $FDX might push the price to a new all-time high above $320.57.