fbpx

Yen Strength Can’t Persist

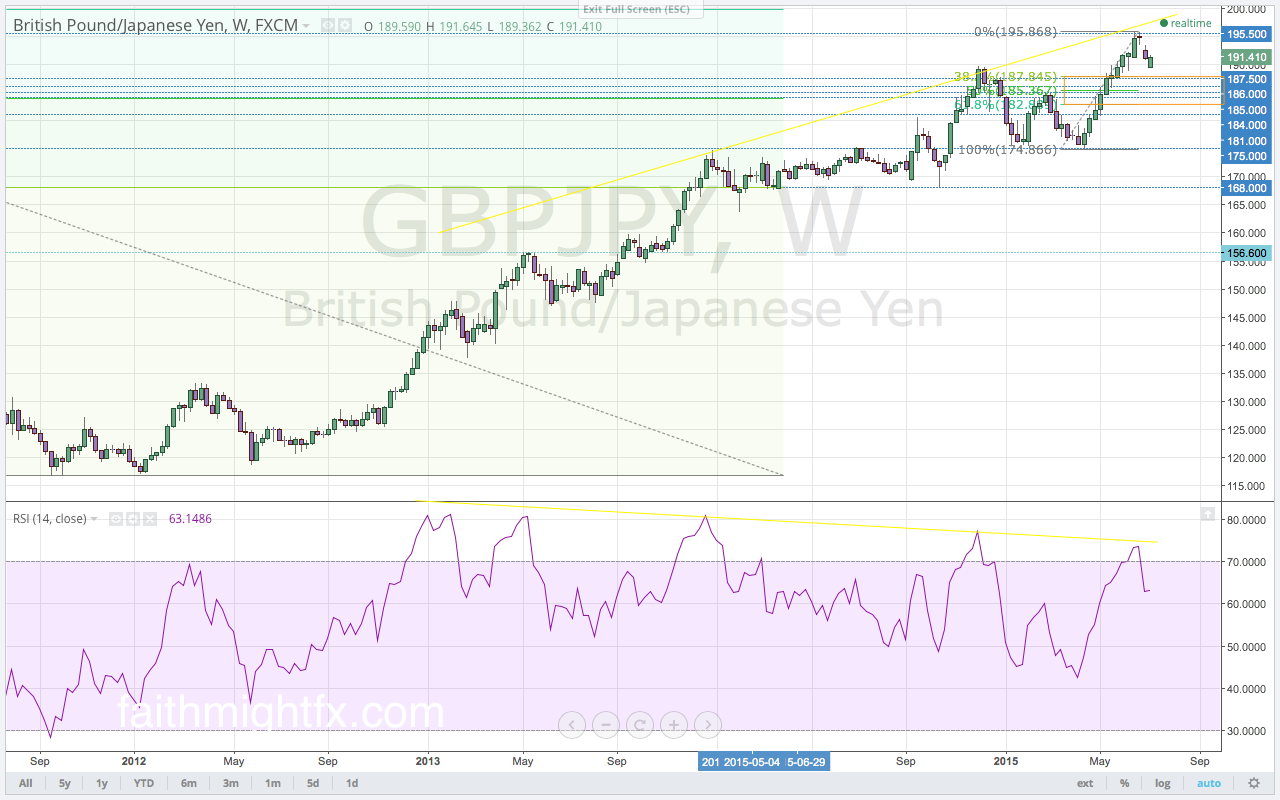
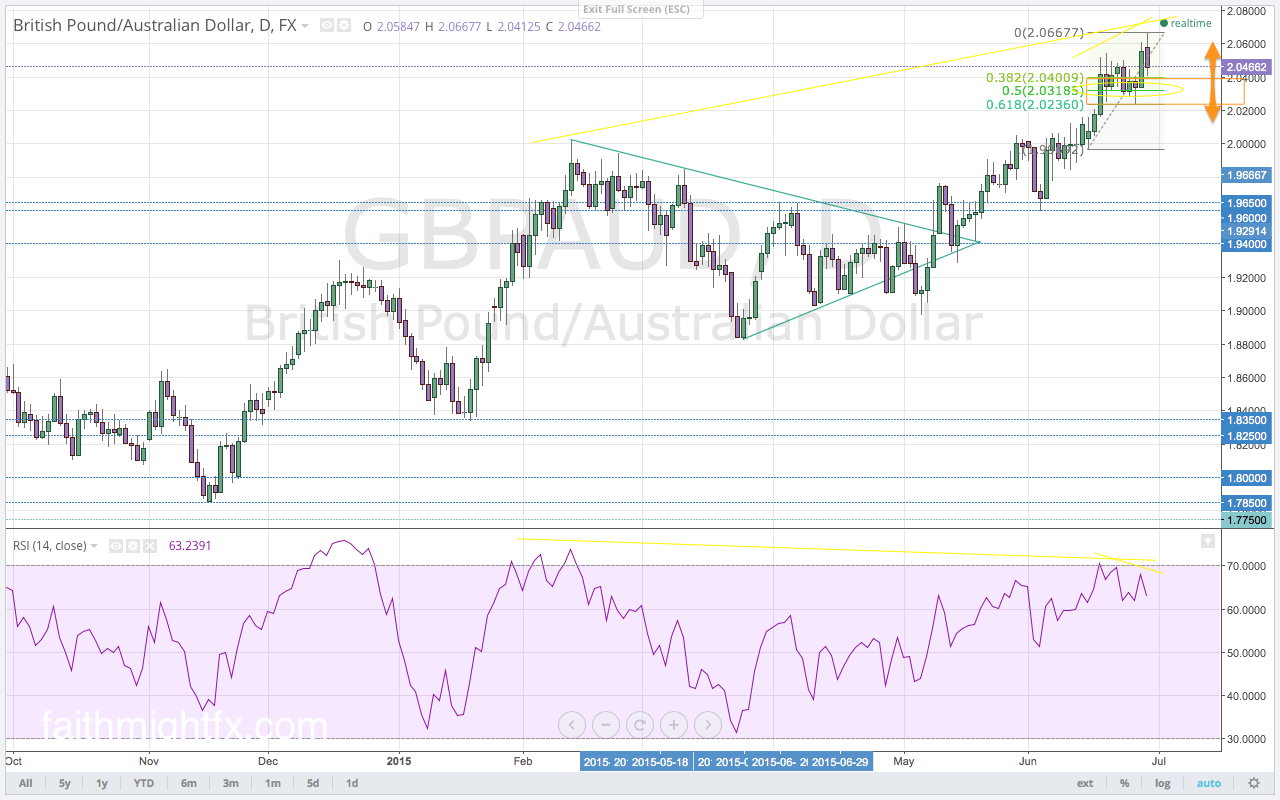
The Bank of Japan (BoJ) has not objected to the recent strength in the Japanese yen. The Japanese yen continues to benefit from the risk aversion flows that are clamoring back into the markets when equity markets crashed around the globe. The recent move lower in U.S. equities has been highly correlated with a stronger Japanese yen due to risk aversion flows in the market. This week, however, risk appetite looks to fuel safe haven selling. Additionally, the BoJ may look to increase its already substantial QE program as early as next month. With deflationary pressures still prevalent in the Japanese economy and signs of softening economic data, the GBP/JPY may not be able to continue its descent lower (Volume 31). The weakening Japanese fundamentals is likely to support a rally in the GBP/JPY on the back of sustained JPY weakness. With the recent lows holding in the buy zone above the 61.8% Fibonacci level, a Fibonacci move could spark a rally back to the 195.50 highs.

GBPJPY 4 HOUR CHART

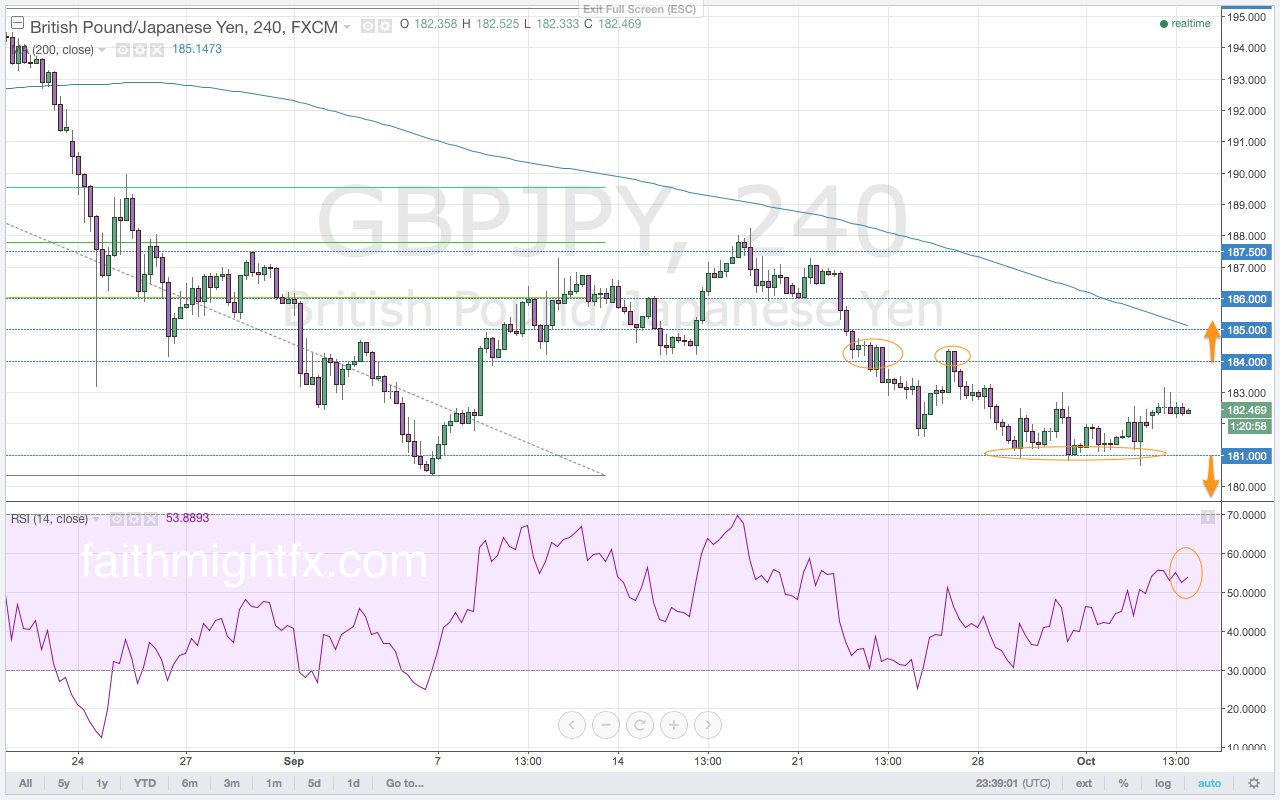
After falling to 180.34, the GBP/JPY staged a corrective rally in the two weeks ago to the 50% Fibonacci level. Making a new high at 188.26 on Federal Reserve volatility in the sell zone, the GBP/JPY made new lows last week to 180.66. Into the end of last week, selling momentum exhausted and price moved higher. The now failed lows signal a move higher for the GBP/JPY. Future direction will be largely dictated by the capital flows in U.S. equity markets. The failed lows in the GBP/JPY also coincide with the aforementioned failed low in the S&P 500. Increasing strength in the S&P 500 will have to overcome the key 2040 resistance level to see a new high higher than the previous 188.26 high in the GBP/JPY. Though a new high can still respect this sell zone, a sustained rally in U.S. equities supports a complete reversal in the GBP/JPY back to the highs. If, however, the S&P 500 retests the 1867 lows, the GBP/JPY can move lower from current levels to its zone of support between 176.20 and 174.86. A confirmed close below the 181.00 support level becomes an early signal of a continuation lower. A confirmed close above the 184.00 resistance level signals a move back to the previous highs above the 188.00 level.

Outlook for the week…


This is an excerpt from this week’s issue of QUID REPORT. Subscribers receive my research on all major GBP pairs at the beginning of the week, including access to @faithmightfx on Twitter for daily, real-time updates to the weekly report. AVAILABLE NOW.

US Dollar Responds to Risk over Fundamentals

The Federal Reserve did indeed delay to move interest rates again last week. But they did change their monetary policy statement with a sentence of concern for the global economy. Equities reacted to this dovish surprise by selling risk assets. Now investors look to the upcoming third quarter earnings season for coincidental evidence to confirm or refute the world’s concern of Chinese headwinds on capital markets. Therefore, the USD did weaken as expected it would on further delay in increasing interest rates. The $GBPUSD rallied to make a new high at 1.5658. While there were many in the market not expecting the interest rate hike, no one was expecting a more dovish statement and negative interest rates plotted on the dot graph. These developments were both very dovish surprises not anticipated nor discussed. The implications for this sentiment to trend could be either damaging for the USD or very beneficial for the USD. As market expectations for liftoff diminish, the USD should weaken accordingly. Despite strong data 2 weeks ago (Volume 28), U.S. data was extremely weak last week. Soft data is only going to delay the Federal Reserve further. Risk aversion in the markets, however, could strengthen the USD as safe haven flows dominate market flows.

Just last week, the data showed a strong U.S. economy that could force the Federal Reserve to raise interest rates this September. Many market participants believed there was no reason for the Federal Reserve not to raise interest rates last week. Apparently, there is a reason to keep interest rates at 0%. And that reason is China. The highly active accommodation out of the PBoC is revealed to be an actual concern for the Federal Reserve. They are concerned enough to further delayed their initial liftoff plans. Inflation is another, more domestic reason why the Federal Reserve will stay put on interest rates. The central bank sees inflation at 1.6% over the next 2 years. That is well below their target of two percent. As a result, the Fed funds futures show diminishing expectations for an interest rate hike in 2015 altogether. The USD cannot rally as markets start to accelerate the unwinding of expectations for increased U.S. rates. Now that the market perceives that the Federal Reserve will not hike interest rates at all, the GBP/USD may begin to break consolidation to the upside for a trend move back to 1.6000. Those spring calls for 1.6500 become very much in play now based on this new fundamental development.

GBPUSD 4 HOUR CHART

The break to new lows was seemingly a bearish event. The failed high moved exactly where it was supposed to making new lows below the previous 1.5329 low. Price then found staunch support at the 1.5162 level. Supply at this level met bids and rallied higher in trading last week. The $GBPUSD broke well above the sell zone that begins at 1.5413 after the Federal Reserve announcement. Such a move higher moved selling momentum higher into bullish territory. The 1.5500 support level is also a huge psychological level. The USD is likely to weaken further on a more dovish Federal Reserve. If this new sentiment causes extreme volatility in equity markets, however, the USD could actually rally on safe haven flows. Therefore, this buy zone is important to help determine direction for the week. The high last week was just 22 pips from the top of the range. So if the range top holds, the $GBPUSD is actually making a reversal move back to lows. A break or hold of the 1.5450 level is key because it has confluence with the 61.8% Fibonacci level.


This is an excerpt from this week’s issue of QUID REPORT. Subscribers receive my research on all major GBP pairs at the beginning of the week, including access to @faithmightfx on Twitter for daily, real-time updates to the weekly report. AVAILABLE NOW.

Bank of Canada no longer spooked by oil

Oil markets rallied last week on the back of the weaker USD in light of no change in U.S. interest rates. The close on Friday is the first close above the 2.0500 resistance level since the week before Black Monday. The $GBPCAD opens the new trading week extending the rally further as risk appetite wanes in the general capital markets. If this week also ends above the 2.0500 resistance level, it confirms this tentatively bullish bias in the GBP/CAD.

GBPCAD WEEKLY CHART

The Bank of Canada (BoC) surprised markets this month with no change in monetary policy. While the crude oil markets have plunged to new lows, the recent weeks have seen prices consolidate. The BoC feels that inflation remains inline with its outlook for the year. Though exports remain uncertain, the lower value in the Canadian dollar has helped to absorb the impact of low commodities by bolstering domestic demand. After already cutting interest rates twice this year, the BoC remains at ease with allowing those cuts to continue to work through the economy. Despite the cheerier disposition this month, the BoC remains a very dovish central bank as long as oil markets remain weak. There have even been whispers that the BoC may implement quantitative easing in 2016. With a less dovish stance in this month’s monetary policy statement, the Canadian dollar met with buying strength. This CAD strength pushed the $GBPCAD below the key 2.0100 support level. The $GBPCAD made new lows at 2.0028 before finding support and moving higher above the 2.0500 resistance level. The key 2.0100 support level remains the important level on a sustained move to the downside (Volume 22). However, last week price closed just above the 2.0500 resistance level. This resistance is the level to watch in the new trading week.

GBPCAD DAILY CHART

The $GBPCAD finally succumbed to the bearish divergence that had been building on the daily chart since mid-July. With a new low in momentum and a breach below the RSI 60.0 level, the $GBPCAD corrected lower to the 2.0028 lows before rallying higher off the lows. The follow through lower from the bearish divergence pushed momentum into selling territory last week. However, price was unable to close below the important 2.0100 support level with confirmation even with selling momentum behind it. The rally met profit-taking flows ahead of the weekend with the close at 2.0516. With confluence between the resistance level and the 50% Fibonacci level, there is staunch resistance at the 2.0500 level. As the rally extends higher in the open of the new trading week, momentum remains out of bearish territory. With a confirmed close above the resistance level, $GBPCAD looks to move higher. A break of the 61.8% Fibonacci level sees the $GBPCAD rally higher for a reversal back to the 2.0970 multi-year highs.


This is an excerpt from this week’s issue of QUID REPORT. Subscribers receive my research on all major GBP pairs at the beginning of the week, including access to @faithmightfx on Twitter for daily, real-time updates to the weekly report. AVAILABLE NOW.

More Relief for the Euro

The $EURGBP ended last week back above the key 0.7000 support level. After breaking last week’s low, the EUR/GBP printed another failed low at 0.6949. The first failed low at 0.6984 was a result of a euro relief rally. Just when it seemed as though the $EURGBP was moving lower within its Fibonacci move, the BoE released its dovish policy statement and inflation report. The unwinding of interest rate expectations is now the reason for the latest rally in the $EURGBP. As a new fundamental shift in the markets, this rally looks to carry much more credibility than the last. As such, the failed low looks to target new highs above the previous high at 0.7159. The one obstacle for bulls is the 0.7100 resistance level. The rally into the end of the week held below this important level for another weekly close below 0.7100. When there is a close below the 0.7100 level, there is a subsequent drop in prices. When there is a weekly close above the 0.7100 level, the $EURGBP typically rallies after the subsequent hold of support. So last week’s close looks like a bearish signal for the $EURGBP. However, it is more likely price met profit-taking at the key level after a bullish week. It is expected that the $EURGBP continues to rally in the new trading week to break above the 0.7100 resistance level.

EURGBP DAILY CHART

The $EURGBP repeated price action last week from the week prior. The failed low led to a rally that held below the 0.7100 resistance level. However, the new trading week is opening very differently from last week’s open. Last week, the $EURGBP immediately slumped lower as the market anticipated a bullish BoE Thursday and a hawkish BoE in the coming week. Now as the market processes new expectations in interest rates and a more dovish BoE, the $EURGBP opens the new week still elevated just below the 0.7100 resistance level. Momentum on the daily chart is back in bullish territory to start the new trading week. The price action at the open this week versus last week leads to a conclusion that the $EURGBP is looking to break to new highs. If the $EURGBP is unable to make a new low below the 0.6949 failed low, then a rally will set in that targets a new high above the 0.7159 high. It is important to note that a new high can still respect the sell zone for a Fibonacci move lower. However, with a second failure to make new lows below the 0.6929 lows, the probability is tilted towards a move higher above the key resistance level at 0.7100.


This is an excerpt from this week’s issue of QUID REPORT. Subscribers receive my research on all major GBP pairs at the beginning of the week, including access to @faithmightfx on Twitter for daily, real-time updates to the weekly report. AVAILABLE NOW.

CHART OF THE WEEK: RBA WAGS BACK

The $GBPAUD daily chart posted this week is the clear winner.

I like the Reserve Bank of Australia (RBA). They have actually been neutral for weeks. It’s not their fault that their stance against any more accomdative easing this year fell on deaf ears. Blame commodities. Buyers have been fixated on commodity markets. As commodities, including copper and iron ore, crashed into bear markets, forex traders sold AUD in like manner. The $GBPAUD rallied over 20,000 pips. Since MAY. That’s an incredible bull rally, by an measure. Markets simply ignored the RBA. Until this week. Monetary policy action and the statement this week showed an adamant central bank in their stand to allow the interest rate cuts this year to do their work. The RBA even appreciates the weak AUD. It bolsters domestic demand in the face of slowing exports. So no complaints there. Unlike their counterparts in Switzerland, the RBA is happy to have traders do their dirty work. Smart.

The price action and close this week do serious technical damage to this chart right here.


GBPAUD DAILY CHART


This chart is an excerpt from this week’s issue of Quid Report. Subscribers receive my research on all major GBP pairs at the beginning of the week, including access to @faithmightfx on Twitter for daily, real-time updates to the weekly report. AVAILABLE NOW.

BoE Thursday Provides Clarity

After three weeks of trading, the USD has been unable to move the $GBPUSD lower since the lows at 1.5329. The rout in the commodity markets, from wheat to iron ore and from oil to diary, has strengthened the USD. Federal Reserve Governor Yellen continues to hint towards higher interest rates in 2015. The Federal Reserve rather be ahead of the curve on inflation by increasing interest rates even as oil falls and despite the already strong USD. With weak commodities and a pending U.S. interest rate increase, the $GBPUSD looks to resume its overall downtrend. However, the $GBPUSD has become stuck in a range of increasingly higher lows and higher highs. As such, the bullish bias has returned to the $GBPUSD. The longer the $GBPUSD remains above the 1.5500 level, the probability increases for the next move to be to the upside. Such an upside move looks to the complete the Fibonacci move with a rally that breaks above the 1.5929 highs. The 1.5700 level is now a key level for direction to the upside. A confirmed break above that area of resistance signals a resumption of the rally. Momentum is in bullish territory though the hold below the 60.0 level on the RSI holds bearish implications. The 1.5250 support level is a key level for direction to the downside. A confirmed break below this level will accelerate $GBPUSD losses back to the 1.5169 lows to complete the reversal kicked off by the break below 1.5459 (Volume 19).

GBPUSD DAILY CHART

Over the last several trading weeks, it has become peculiar to see the $GBPUSD unable to move lower as the USD surges against commodities during the same time period. The $GBPUSD carved a range of consolidation in the sell zone on the daily chart. The highs of the range above the 1.5600 level are simply a series of failed highs after bouncing out of the Fibonacci levels on the weekly chart. Without a move back to lows after spending four weeks above the 1.5500 support level, the $GBPUSD now looks to move higher still. The USD rally continues to loose momentum with every weak economic release. A weakening economy may be enough to delay interest rates hikes in the U.S. despite the hawkish hints from Governor Yellen.

The biggest driver of a hawkish Federal Reserve was increasing inflation, particularly in wages. The release of the employment cost index showing a decline holds big implications for the release of the U.S. jobs report. If hourly wages decline in the release this week and confirm the weak employment cost index, the $GBPUSD aims to breaks above the top of the range. A break of the range to the upside looks to complete the Fibonacci move of the weekly chart. If, however, the jobs report is another strong report, the $GBPUSD will move lower in an attempt return to the 1.5329 lows. The key level to watch on a break of these lows is the larger 61.8% Fibonacci level at 1.5086. Given that this the bottom edge of a buy zone, there remains the possibility for a rally off new lows.


This is an excerpt from this week’s issue of QUID REPORT. Subscribers receive my research on all major GBP pairs at the beginning of the week, including access to @faithmightfx on Twitter for daily, real-time updates to the weekly report. AVAILABLE NOW.

RBA Remains Neutral

Since consolidating in a triangle pattern back in March, the $GBPAUD has extended its break of the triangle pattern to stage a breakout rally to 2.1527. This breakout above the 2.000 resistance and major psychological level to highs took out the former highs on both the daily and weekly charts. The monthly chart must be studied for the potential of a continuation higher. Having broken above the large 50% Fibonacci level at 2.0720, this breakout rally now targets the 61.8% Fibonacci level at 2.2217. The break above the 50% Fibonacci level is a very bullish development for the $GBPAUD as it signals that price will continue to move higher. A break of the 61.8% Fibonacci signals a complete reversal. The rout in commodities has been a sore spot for the Australian dollar. Iron ore and copper, two of Australia’s largest exports, have suffered steep declines in price along with oil. Though the RBA did not move on monetary policy last month, they have stated that they were unlikely to ease monetary policy again this year despite its economy softening in the face of commodity weakness. Despite the RBA reducing calls for more easing, AUD selling has not abated. Copper, oil and gold have all opened the new trading week accelerating to new lows. If the RBA can stand firm with this more neutral sentiment in their interest rate announcement this week, the $GBPAUD may begin to turn lower.

GBPAUD DAILY CHART

The $GBPAUD completed its Fibonacci move from last week when it moved to new, multi-year highs at 2.1527. Despite the new, multi-year high in price, momentum is still diverging on the daily chart. This bearish divergence signals for another corrective price move lower in price. As the correction works price lower, momentum should find support at the 60.0 level. This level on the RSI has been a strong support for momentum during corrections in the $GBPAUD since breaking above the all-important 2.00, now turned, support level. With momentum currently out of overbought territory, price will have supportive buying momentum to move the $GBPAUD to new highs again. If momentum were to take out that support level on the RSI that would be a tentative signal that the $GBPAUD may be looking for a reversal. However, the bearish divergence alone is not enough to deter buyers. The $GBPAUD can still rally to new highs but if the RBA continues with more neutral sentiment after their interest rate announcement that could, in fact, trigger a selloff.


This is an excerpt from this week’s issue of QUID REPORT. Subscribers receive my research on all major GBP pairs at the beginning of the week, including access to @faithmightfx on Twitter for daily, real-time updates to the weekly report. AVAILABLE NOW.

CHART OF THE WEEK: THE OZ WAGS AT RBA

Despite the RBA reducing calls for more monetary easing, the $GBPAUD continues to march ever higher on the back of a weak Australian dollar. Quid Report readers are enjoying this pair. While it has exhibited great technical edge, its fundamental edge has developed nicely in recent months for the ultimate double whammy. Trade the currency pairs with a double whammy. This is one.


GBPAUD MONTHLY CHART


This chart is an excerpt from this week’s issue of Quid Report. Subscribers receive my research on all major GBP pairs at the beginning of the week, including access to @faithmightfx on Twitter for daily, real-time updates to the weekly report. AVAILABLE NOW.

Is Risk Aversion Here To Stay?

The Japanese yen has found new strength on the back of risk aversion flows. It is one of the biggest beneficiaries as a safe haven currency. With the Swiss National Bank intervening to prevent safe haven flows from strengthening the Swiss franc and the U.S. dollar dealing with new interest rate expectations, the JPY has received a bulk of the risk aversion flows in the market. Evidence of this is the huge gap down the $GBPJPY experienced when the new trading week opened compared to the $GBPUSD or GBP/CHF. As the Greek debt crisis now deals with this new normal — a rejected austerity plan and debt repayment package — the $GBPJPY may continue to move lower.

GBPJPY WEEKLY CHART

The $GBPJPY made a new low at 189.59 [on Monday], establishing a level of support for the week. A move below the gap low targets the 38.2% Fibonacci level at 187.84. The major support and psychological level at 1.9000 is the level to watch for direction in the new trading week. The prior bullish wave already found resistance just ahead of the 1.9000 level at 189.68. Last week’s bounce higher after the gap down still has yet to fill the gap even as the bounce higher this week has already filled the gap. A continued inability of the $GBPJPY to fill its own, very large gap is a bearish signal. Coupled with the building bearish divergence between price and momentum at the recent 195.86 new highs, the $GBPJPY is poised to move into a deeper correction of the entire rally off the 175.00 major support level.

Momentum on the daily chart waned very sharply at the highs last week. This sharp decline in buying momentum resulted in multiple false breaks of the 195.50 resistance level. Though the gap lower is due to fundamental reasons, its occurrence lines up with the technical developments over the last several trading sessions. Already lower than the previous low on the RSI, this new selling momentum has broken below the 50.0 level into bearish territory. The gap lower this week has broken below the major 190.00 support level. However, that price move lower was immediately met with bids that rallied price right back above the 190.00 level to a high of 191.64. These highs are finding resistance ahead of last week’s lows. If the $GBPJPY is unable to move higher, it is likely that price will fall back towards the 190.00 support level.


This is an excerpt from this week’s issue of Quid Report. Subscribers receive my research on all major GBP pairs at the beginning of the week, including access to @faithmightfx on Twitter for daily, real-time updates to the weekly report. AVAILABLE NOW.

CHART OF THE WEEK: IT GETS EASIER

Each week, I highlight a chart out of the Quid Report.

After highlighting the Australian dollar last week, the $GBPAUD continues to soar to new highs. This week, the move out of the Fibonacci levels on the correction lower has moved to new, multi-year highs yet again. Momentum is trying to do something about that bearish divergence as bulls are not to be dissuaded. Between a crashing Chinese stock market, a slowing Australian economy and weak commodities, the AUD just can’t get a reprieve from the selling. It is expected to remain weak too for as long as this fundamental trifecta remains a narrative in the market.


GBPAUD DAILY CHART


This chart is an excerpt from this week’s issue of Quid Report. Subscribers receive my research on all major GBP pairs at the beginning of the week, including access to @faithmightfx on Twitter for daily, real-time updates to the weekly report. AVAILABLE NOW.