fbpx

CHART OF THE WEEK: FAILURE MEANS SOMETHING

Each week, I highlight a chart out of the Quid Report.

The $GBPJPY failed above the 195.50 resistance level all week. Now that $GBPJPY has moved lower off these highs this week, is it now ready to break higher?


GBPJPY 4 HOUR CHART


This is an excerpt from this week’s issue of Quid Report. Subscribers receive my research on all major GBP pairs at the beginning of the week, including access to @faithmightfx on Twitter for daily, real-time updates to the weekly report. AVAILABLE NOW.

The Easy Aussie Dollar

The release of the meeting minutes from the Reserve Bank of Australia (RBA) was met with AUD selling. The RBA maintained its dovish sentiment despite not making any changes to monetary policy at its last meeting. They, too, downgraded their economy. Even though the Australian labor market is still strong, households are laden with debt and are simply not spending money. While officials at the RBA expressed satisfaction with the effects of current monetary policy, they believe policy needs to remain accommodative. It is their assessment that the economy still requires a weak AUD trading at even lower levels. The minutes confirmed the dovish remarks from RBA Governor Stevens just the week prior. As a result, the $GBPAUD continues its rally to new, multi-year highs.

GBPAUD WEEKLY CHART

Momentum continues to build a bearish divergence with every new high. Last week was no exception. There still remains a bearish divergence that suggests the $GBPAUD is due for a correction. Despite the divergence in momentum, the $GBPAUD is in breakout mode. It has soared to new highs and continues to close above the important 2.00 support level. But the decreased buying momentum is glaring. The new highs at 2.0548 were accompanied by even more bullish momentum than last week’s new highs. That is a good sign for buyers this week. It suggests that fresh buyers are back in the market assured by the dovish RBA.

The $GBPAUD has maintained an orderly rally even with the dovish RBA. Momentum followed with building bullish momentum following the rally to new highs. Last week, however, the $GBPAUD established new highs on the daily chart with less momentum than at the previous high price. With diminishing buying momentum on these new highs and a bullish close, a breakout higher could produce a false break. If price is unable to hold above the 2.0344 lows with adequate buying demand, the buy zone at the Fibonacci levels will come into play.


This is an excerpt from this week’s issue of Quid Report. Subscribers receive my research on all major GBP pairs at the beginning of the week, including access to @faithmightfx on Twitter for daily, real-time updates to the weekly report. AVAILABLE NOW.

How Much More Loonie Weakness?

The resumption in oil weakness has kept the $GBPCAD supported on the back of CAD weakness. Weakness in oil markets may also resume the dovish sentiment out of the Bank of Canada (BoC). While the BoC welcomed the weaker CAD that resulted from the slide in oil prices, the return of weak oil could also mark the return of the doves to the BoC. Recently, however, oil markets have stopped crashing and started consolidating. This stabilization may mean another push lower in oil is eventually coming. As long as the crude oil futures market are unable to rally further beyond the $60 level, the $GBPCAD will find traction to move higher.

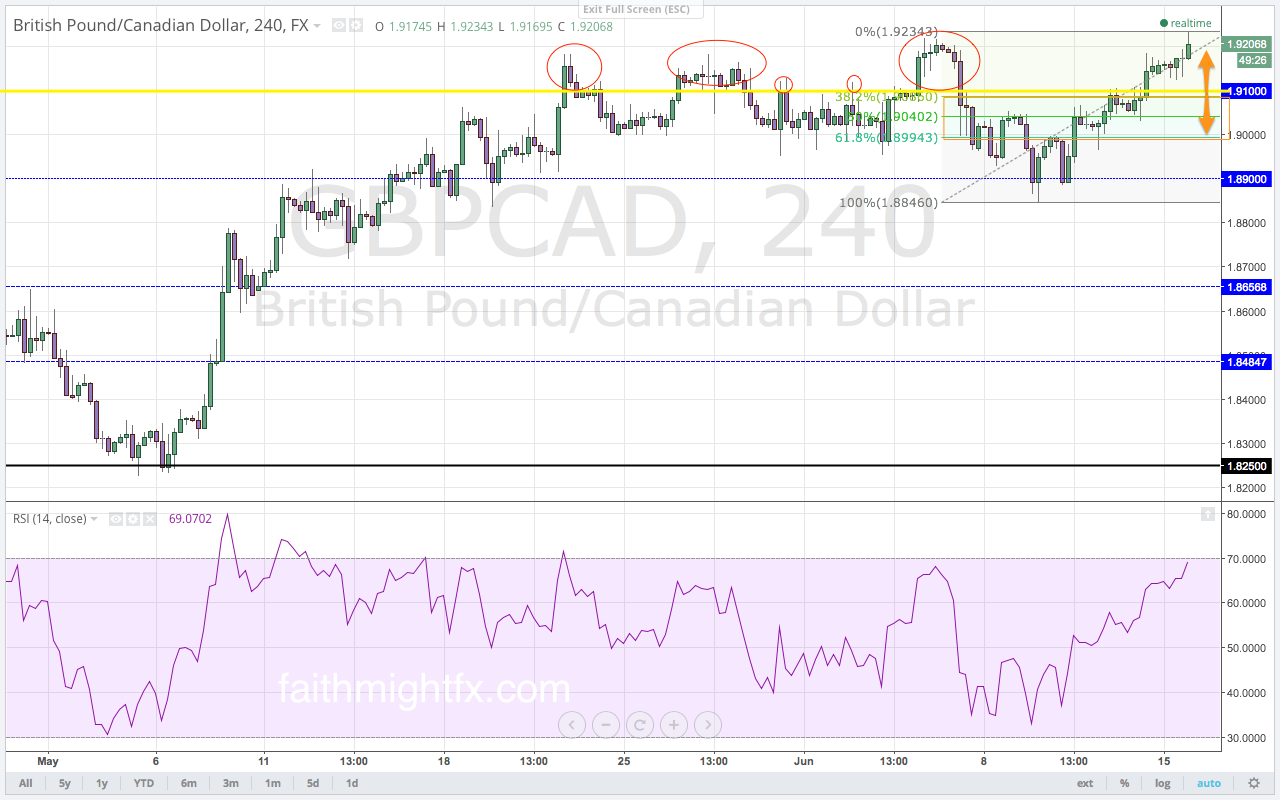
The $GBPCAD had been range bound between 1.8900 and 1.9100 as oil markets consolidated. Thus, it has been Canadian economic data dictating direction in the $GBPCAD in recent weeks. Despite a good housing starts number released last week, it was the poor capacity utilization number that weakened the CAD. The $GBPCAD moved back above the 1.9100 resistance level to close the week. The new trading week has already seen a weak Canadian manufacturing sales report rally the $GBPCAD to new highs at 1.9234. These new highs complete the Fibonacci move after last week’s correction. With wholesale sales, retail sales and inflation numbers to be released this week, any weak data will see the $GBPCAD continue its rally back toward the highs at 1.9555. However, strong data will cause the $GBPCAD to retrace the current rally.

GBPCAD 4 HOUR CHART

With the close of last trading week above the 1.9100 level, the $GBPCAD had its first bullish close above the range between 1.9100 and 1.8900. Manufacturing data is such a market mover for the CAD because of Canada’s export-dependent economy. In fact, last week BoC Governor Poloz warned of weak economic effects due to bad weather extending into the second quarter of economic activity. The weak data seems to confirm this BoC warning issued just last week. Therefore the CAD will be on the back foot in trading this week. This CAD weakness will only be amplified on any weakness in the crude oil markets.


This is an excerpt from this week’s issue of Quid Report. Subscribers receive my research on all major GBP pairs at the beginning of the week, including access to @faithmightfx on Twitter for daily, real-time updates to the weekly report. AVAILABLE NOW.

CHART OF THE WEEK: HOME IN THE RANGE

Each week, I highlight a chart out of the Quid Report.

The euro behaved as expected in this week’s Volume 15. The levels on the daily chart foretold the dramatic story of Greece. The week started off with a deal taking shape that rallied the $EURGBP off the 0.7250 level.  Then Greece played hard ball and the IMF left. Germany said the euro was too strong. $EURGBP peaked and fell to 0.7200. $EURGBP rallied off that support to close the week in that quirky little zone between the arrows. How will euro trade next week?


EURGBP DAILY CHART


This is an excerpt from this week’s issue of Quid Report. Subscribers receive my research on all major GBP pairs at the beginning of the week, including access to @faithmightfx on Twitter for daily, real-time calls and adjustments to the weekly report. AVAILABLE NOW.

RBNZ Ushers in More Kiwi Weakness

The $GBPNZD continued its move higher last week by extending the rally to new highs at 2.1709. Since the breakout rally took out the former highs on both the daily and weekly charts, we must look to the monthly chart for the potential of a continuation higher. Looking at the monthly chart, the importance of the 2.1050 level is significant for future direction. After finding resistance at the 2.2050 level back in, the $GBPNZD made many attempts to move lower. Soon the $GBPNZD was trading in a huge range between 2.1050 and 1.9250. The past two months found price holding the bottom of that range to breakout above the range top. With a confirmed close above the key 2.1050 level, the $GBPNZD has potential to move higher still. The next major level of resistance is found just above the major 2.2000 psychological level.

GBPNZD MONTHLY CHART

While the breakout of last week took price to new highs, momentum, on the other hand, did not follow suit. The RSI shows a bearish divergence on the daily chart at the highs. This divergence has the potential to push price lower into the buy zone marked by the Fibonacci levels of the latest bullish wave. Though the 2.1050 level is a key level for direction, it is the 2.0800 level that must hold as support for the $GBPNZD to maintain its bullish bias.


This is an excerpt from this week’s issue of Quid Report. Subscribers receive my research on all major GBP pairs at the beginning of the week, including access to @faithmightfx on Twitter for daily, real-time updates to the weekly report. AVAILABLE NOW.

CHART OF THE WEEK: USD BULLS RETURN

Each week, I highlight a chart out of the Quid Report.

While the timing still may be unknown, the Federal Reserve remains on track to raise interest rates this year. This makes the $FED the most hawkish central bank in the world. Despite the recent bout of weakness, the USD should rise due to the contrast in monetary policy between the Federal Reserve and the rest of the world. The reason that USD weakness may persist is that the U.S. economy is not strong enough to justify aggressive monetary tightening. While the $FED may be considering a schedule of interest rate hikes, it cannot commit to it with the U.S. economy still so fragile. So even if the $FED surprises markets with an interest rate hike in June, it is unlikely it will spark a change in trend. While there will be a knee jerk reaction when the $FED raises interest rates, the USD could continue to weaken if markets price in a delay in subsequent interest rate hikes for as long as the U.S. economy remains soft.


GBPUSD WEEKLY CHART


This is an excerpt from this week’s issue of Quid Report. Subscribers receive my research on all major GBP pairs at the beginning of the week, including access to @faithmightfx on Twitter for daily, real-time calls and adjustments to the weekly report. AVAILABLE NOW.

A Failing Euro

The $EURGBP completed its Fibonacci move from the highs at 0.7482 with the new low below 0.7128. While it didn’t appear to be the top at the time, the euro became mired in Greek financial drama last week. The smoke-and-mirrors of Greek repayment is once again wearing thin on the markets. The euro had been rallying higher as Greece communicated ability to repay its debts. Then last week, the European Central Bank (ECB) meeting minutes confirmed the ECB’s satisfaction with its quantitative easing (QE) program and its intended effect on financial markets. The euro collapsed as markets were reminded that QE continues in full form out of the ECB.

EURGBP WEEKLY CHART ON SUNDAY

While the $EURGBP may have completed a Fibonacci move on the daily chart, the Fibonacci move on the weekly chart still has yet to be completed. The 0.7100 support level is a formidable support level. It became the level against which bids stepped into the market to ignite the latest rally to 0.7482. While price last week did break below the 0.7100 support level, the trading week closed above it. With price already below the support level to start the new trading week, there are a slew of former lows to contend with as the $EURGBP looks to complete price action to the major support level at 0.7000.


This is an excerpt from this week’s issue of Quid Report. Subscribers receive my research on all major GBP pairs at the beginning of the week, including access to @faithmightfx on Twitter for daily, real-time updates to the weekly report. AVAILABLE NOW.

Euro Sighs in Relief

The $EURGBP staged a monster breakout last week. We cited last week that the $EURGBP had the potential to rally if Greece received a bailout. No bailout came but the buyers still stepped out to buy the euro. One reason is just simple profit taking. At the end of the month, traders squared positions after the euro’s break of multi-year support levels. Another reason is the approach of summer trading. Trading desks are getting ready for the thinner summer market environment. So taking profits off the table and squaring up positions for summer trading may account for a large part of these EUR strength flows.

The $EURGBP had been previously range bound. It broke that range to the upside and broke above 0.7250 right away. It quickly confirmed the breakout on a 4-hr chart close above 0.7250. The $EURGBP immediately rallied 166 pips higher to 0.7416. Offers lined up at the highs with profit-takers and sellers. The $EURGBP is in a terrific downtrend after all. The Greek crisis makes it hard to buy euros for the long term so taking profits at the 38.2% Fibonacci level seems very prudent. But as news of a nearing bailout deal that will please everybody is starting to develop, the euro finds itself in a relief rally. The timing of the rally with election jitters underscores the upside move potential in the $EURGBP. The volatility that is supposed to occur around a change in Parliament has dissipated since hitting markets 2 weeks ago. Perhaps now, the week of the election, market volatility will return that can send the $EURGBP higher still.

EURGBP DAILY CHART

If price breaks above last week’s high, it will go to the 0.7500 psychological level. A break higher targets the 50% Fibonacci level at 0.7568. But if price were to move lower in the new trading week, watch the 1st set of Fibonacci levels on the 4-hour chart. These levels mark a correction of the breakout rally of last week. The 38.2% Fibonacci level at 0.7373 should be a place where late buyers will look to enter the rally. Buyers who held from last week know this is also an opportune time to add to long positions. A move lower still targets the Fibonacci levels on the daily chart. These Fibonacci levels are over the entire rally off the 0.7016 lows.


This is an excerpt from this week’s issue of Quid Report. Subscribers receive my research on all major GBP pairs at the beginning of the week, including access to @faithmightfx on Twitter for daily, real-time calls and adjustments to the weekly report. AVAILABLE NOW.

CHART OF THE WEEK: YEN SURGE

Each week, I highlight a chart out of the Quid Report.

The Bank of Japan (BoJ) fueled yen weakness despite keeping monetary policy as is to maintain its massive quantitative easing (QE) program. While the BoJ does not see a need to further expand QE, they do confess that they will not meet their inflation target in 3 years. This admission gave sterling traders the green light to send the $GBPJPY back to the February highs at 184.00. This chart shows an early entry into this rally on dips back below 181.00, well ahead of when the BoJ policy statement was released.


GBPJPY 4 HOUR CHART


This is an excerpt from this week’s issue of Quid Report. Subscribers receive my research on all major GBP pairs at the beginning of the week, including access to @faithmightfx on Twitter for daily, real-time calls and adjustments to the weekly report. AVAILABLE NOW.

My Appearance on FXStreet’s Live Analysis #FXRoom

It was FOMC DAY in the #FXRoom yesterday. A big day for a big interview and Dale Pinkert (@forexstophunter) at FXStreet didn’t disappoint. We talked about the how the $FED may effect markets just a few hours later. I run through some chart art on the $GBPUSD, $EURGBP, $GBPJPY, $GBPAUD, and $GBPNZD. This is my 1st interview since launching Quid Report. So I basically talk through this week’s issue giving traders a sneak peek into my new project. Enjoy the video!