fbpx

CHART OF THE WEEK: GREECE WOES

Each week, I highlight a chart out of the Quid Report.

We have unfinished business in the $EURGBP after the break of support this week. Greece will remain a basket case because the current Greek government is so new, so young and so boldly naive. The old establishment that makes up the Eurogroup will always have tension with Greece as the kids on the block govern in their own way. The latest proposal could really pressurize the euro.


EURGBP DAILY CHART


This is an excerpt from this week’s issue of Quid Report. Subscribers receive my research on all major GBP pairs at the top of the week, including access to @faithmightfx on Twitter for daily, real-time calls and adjustments to the weekly report. AVAILABLE NOW.

Will the RBA let the Aussie strengthen?

When the Reserve Bank of Australia (RBA) made no changes to monetary policy, the AUD managed to strengthen. In light of the recent strength, the RBA has taken to jawboning to weaken the Australian dollar. RBA Governor Stevens released comments as the new trading week opened that sent the AUD lower. Despite the strong jobs report last week and heating housing market in Australia, the RBA still has interest rate cuts on the table for future monetary policy adjustments. In fact, the RBA feels like the AUD can stand to move lower still. These remarks have already sent the AUD lower across the board in early trading.

Since the rally to 2.0027, the $GBPAUD has been on a corrective move lower. This move lower has allowed the overbought momentum that took the $GBPAUD to those multi-year highs to work lower. While still firmly planted in bullish territory on the RSI, momentum is at more reasonable levels. Momentum suggests that a rally higher is still a strong possibility as the RBA sets out to weaken the AUD. Additionally, since the break above the large 38.2% Fibonacci level at 1.9188, price has not managed to close below that level. Even on the decline to 1.8827, the $GBPAUD still closed that month back above the big 38.2% Fibonacci level. Just as hawkish fundamentals were set to push the $GBPAUD lower, the RBA has stepped in to keep the doves in place.
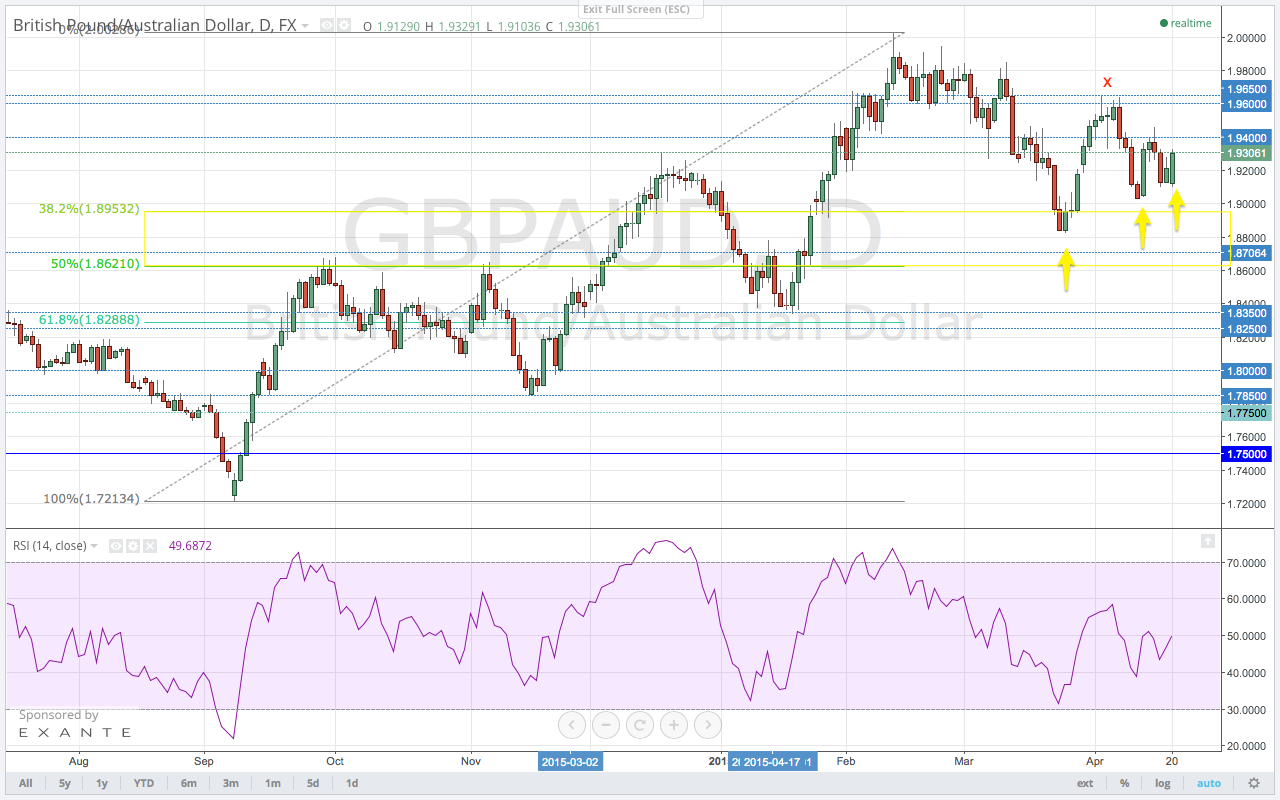
GBPAUD DAILY CHART

After price moved to 1.8827, the $GBPAUD made a failed high right at the 1.9650 resistance level. This failed high is supposed to result in a new low below the 1.8827 low, presumably into the 50% Fibonacci level at 1.8612. But this move lower is a tough go. The market has been unwilling to move lower despite the failed high and strong economic data out of Australia. In fact, price is putting in higher lows on the daily chart. This was not the action expected after a failed Fibonacci move and robust economic data. However, it is now clear that the RBA must be intervening in the currency markets to keep the AUD weak. Now that the RBA has made it very clear that they intend to keep monetary policy accommodative to achieve a weaker AUD, the market has started to move now in accordance.


This is an excerpt from this week’s issue of Quid Report. Subscribers receive my research on all major GBP pairs at the beginning of the week, including access to @faithmightfx on Twitter for daily, real-time calls and adjustments to the weekly report. AVAILABLE NOW.
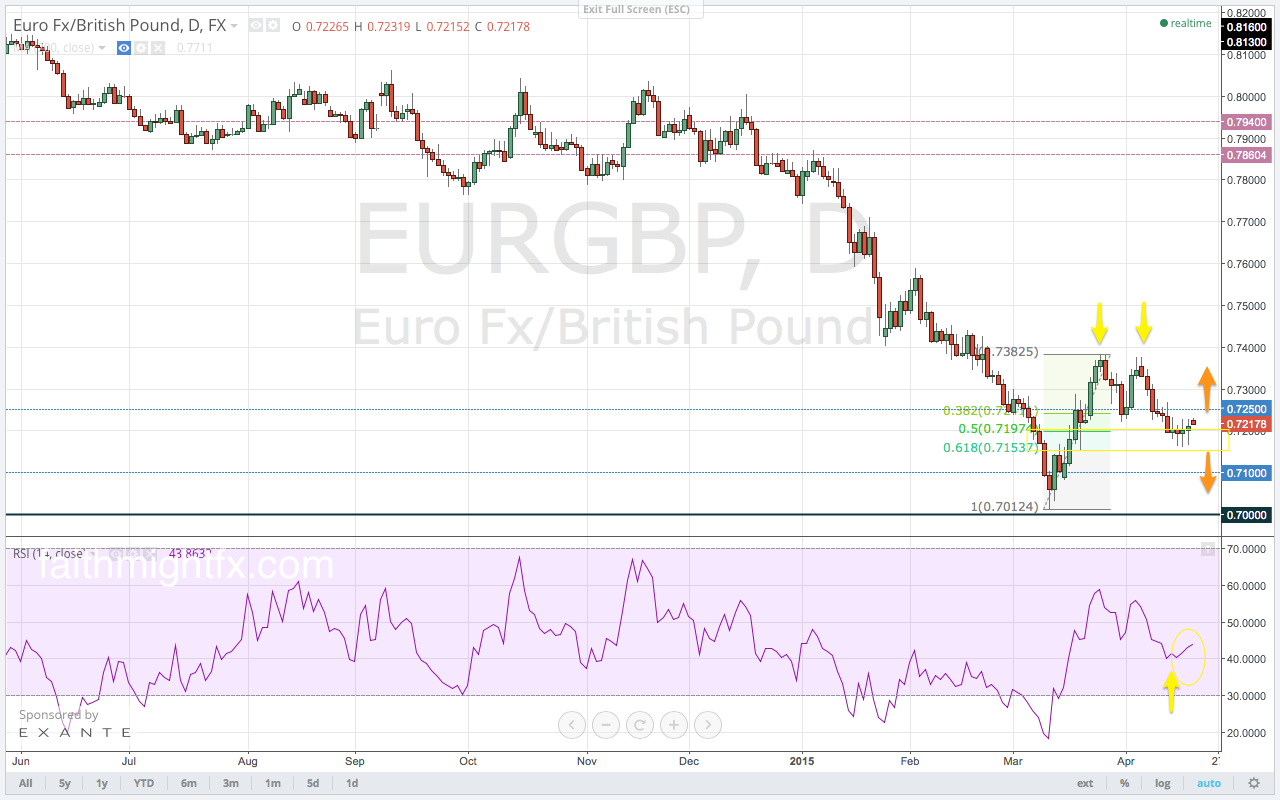
CHART OF THE WEEK: CABLE BULLS

Each week, I’ll highlight a chart out of the Quid Report.

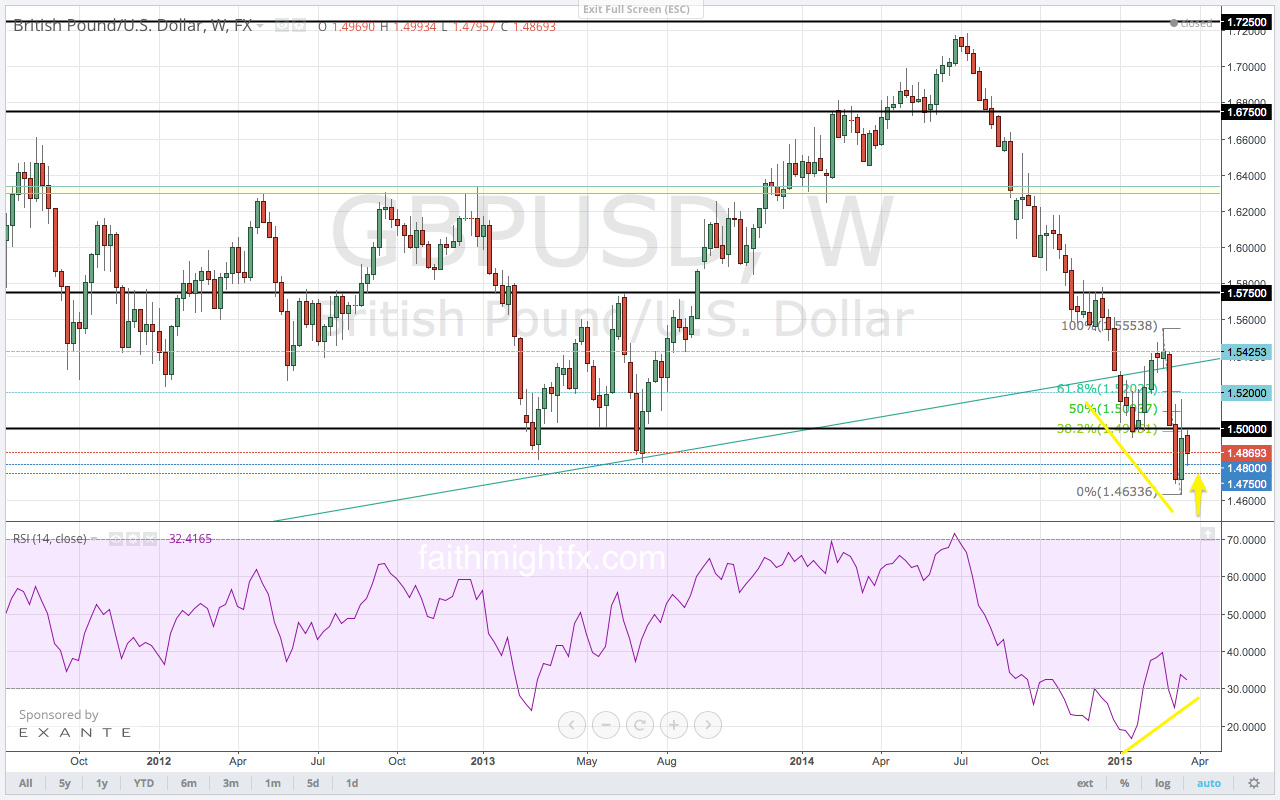
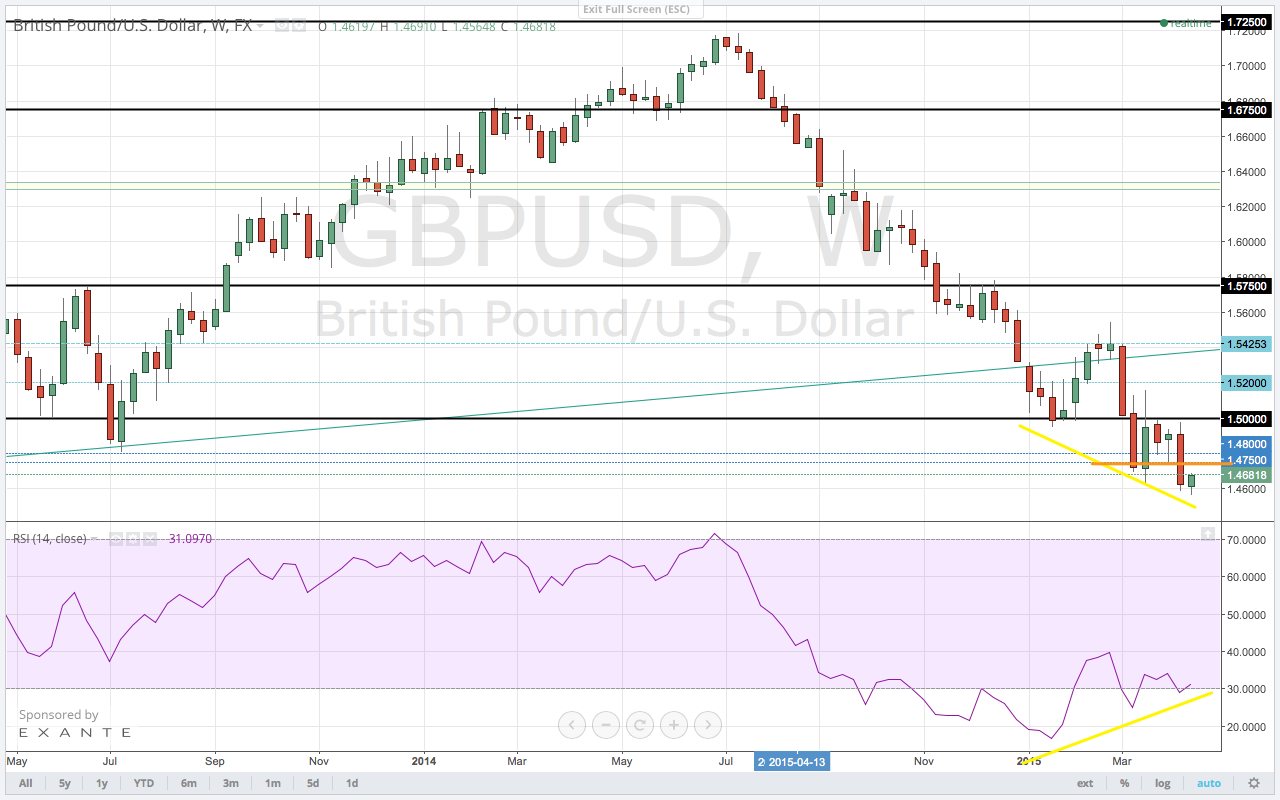
The bullish divergence on the $GBPUSD weekly chart has been developing all year long. This week’s lows at the open and the subsequent rally have put yet another higher low on the weekly RSI. The bullish RSI divergence suggests, however, that price has the potential to return to the resistance level at 1.5000. Sellers are sure to step in at the major psychological level but can they hold off the bulls that having been building momentum all year?


GBPUSD WEEKLY CHART


This is an excerpt from this week’s issue of Quid Report. Subscribers receive my research on all major GBP pairs at the top of the week, including access to @faithmightfx on Twitter for daily, real-time calls and adjustments to the weekly report. AVAILABLE NOW.

The Yen’s End Game is Nigh

The $GBPJPY broke its range and moved lower last weak. Yen strength has been relentless. With the very odd effect of QE actually having a beneficial effect, JPY has been pushing higher across the board.

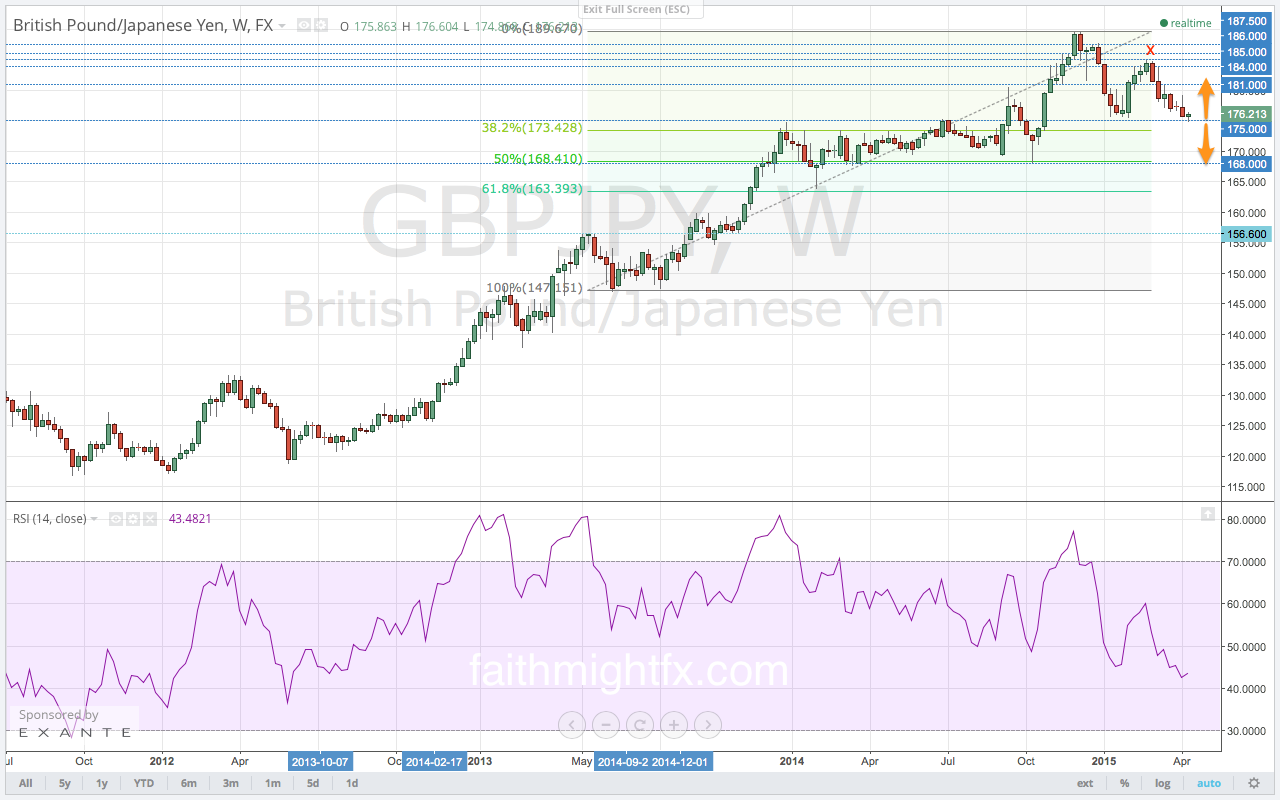
After the breakout of the range to the upside fizzled, it appears that the $GBPJPY would like break lower still. This break of the range to the downside appears much more sustainable now. It is supported by momentum with the RSI still so squarely in the sell side below the 50 level. A break of 175.00 will have to be confirmed by a hold of 175.00 on the eventual bounce off new lows. A hold of 175.00 allows swing buyers to step in on an epic rally back above 181.00.

GBPJPY WEEKLY CHART

The weekly chart confirms the importance of 175.00. The 168.00 level holds a lot of weight to the downside. The 180.00-181.00 resistance zone is critical to the upside. The support level at 175.00 has finally been broken. We have our lower low due to failed highs after the previous attempt at 175.00. Bids were lined up at 175.00 as this bounce has become a reversal. To be sure, late bulls who were more tentative to step in front of the relentless JPY strength, will come in on dips.


This is an excerpt from this week’s issue of Quid Report. Subscribers receive my research on all major GBP pairs at the beginning of the week, including access to @faithmightfx on Twitter for daily, real-time calls and adjustments to the weekly report. AVAILABLE NOW.
QUID REPORT – NOW AVAILABLE

QUID REPORT

Election jitters played out in trading last week as the GBP weakened across the board. Economists and financial media took to extreme headlines about sterling volatility spiking due to the uncertainty surrounding this particular general election cycle. The GBP did slide but election jitters did not take the GBP under siege. Rather, the Bank of England (BoE) hold on monetary policy last week gave the GBP a bit of reprieve from the election selling. Without a statement from the BoE after its policy announcement, the market is left to trade on its own expectations for a series of interest rate increases out of Great Britain to begin in early 2016. However, in the past few weeks, BoE members have taken to jawboning to temper those hawkish expectations.

In addition to hawkish expectations and election jitters, trading this month is already fraught with seasonality themes….

Read the full report: Quid Report, Volume 7 (subscribers only).

CHART OF THE WEEK: YEN STRENGTH

Each week, I’ll highlight a chart out of the Quid Report.

This week it is the $GBPJPY daily chart. We had been anticipating a break of the range into support level since the beginning of the week. The $GBPJPY finally did break lower and now the big 175.00 support level looms ahead.


GBPJPY DAILY CHART


This is an excerpt from this week’s issue of Quid Report. Subscribers receive my research on all major GBP pairs at the top of the week, including access to @faithmightfx on Twitter for daily, real-time calls and adjustments to the weekly report. AVAILABLE NOW.
Can Kiwi Break Out?

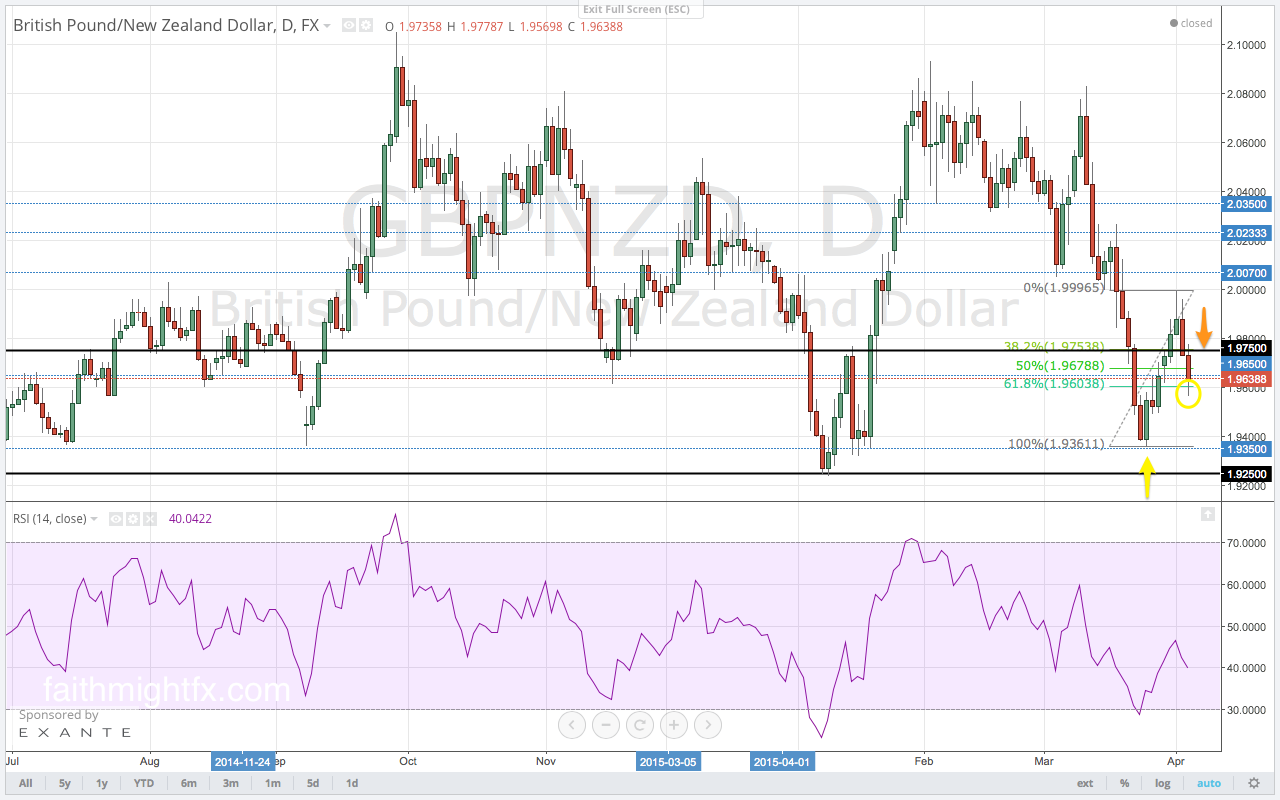
The GBP/NZD rallied as expected last week. It moved higher past the Fibonacci levels to the high at 1.9996. However, the 2.00 level served as formidable resistance for last week’s rally. As warned last week (Volume 5), the pair immediately gave up 2 support levels below the 2.00 resistance when it moved back to 1.9824 after the high. It was at this point, even after the subsequent bounce out of that level to 1.9965, that sellers took back control of the GBP/NZD.

The pullback from the 2.00 resistance level has already breached the 61.8% Fibonacci level of last week’s rally. That is one signal that price will continue lower but it a tentative signal. The GBP/NZD is a volatile pair so an overshoot of levels is not a definitive indication of direction. However, momentum on the RSI is still squarely in bearish territory even after the rally to 1.9996. From this point of view, the GBP/NZD is biased to move lower to support at 1.9350.

GBPNZD DAILY CHART

The GBP/NZD remains range bound between 2.0800 and 1.9350. However, given the failure at the middle of the range it is likely that a return to the range bottom might push to new lows towards 1.9250. This level is the extreme range bottom, if you look at the entire range between 2.1055 and 1.9250. With the RSI on the weekly chart also firmly in the sellers territory, there it seems sellers are looking to push lower than the 1.9569 lows of last week.


This is an excerpt from this week’s issue of Quid Report. Subscribers receive my research on all major GBP pairs at the top of the week, including access to @faithmightfx on Twitter for daily, real-time calls and adjustments to the weekly report. AVAILABLE NOW.

USD Stays On Trend

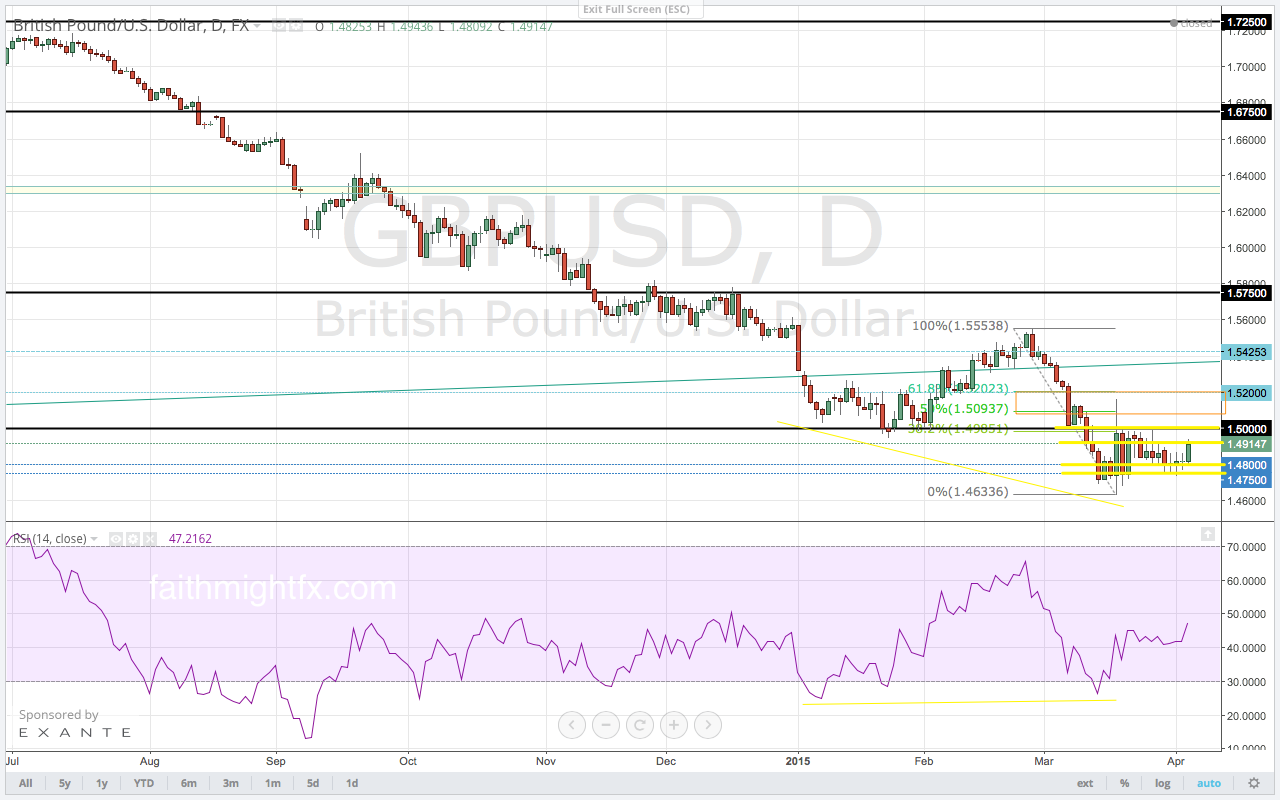
The GBP/USD was unable to push to new lows despite FOMC Chairwoman Yellen’s optimistic comments at the close of last week. The dollar started to rally at the start of the week with cable pushing towards the lows. But the pair found support at 1.4750 and was unable to push lower from there. After much choppy price action between 1.4750 on the downside and 1.4870 on the upside, the USD finally succumbed when the U.S. non-farm payrolls was released on Good Friday. The thin liquidity of the markets, however, was not enough to send the GBP/USD over important resistance at 1.50.

Again, despite the Yellen-induced, lower low from the previous week, the GBP/USD was unable to make new lows on the weekly chart. The markets seized on the headline jobs number missing expectations big on Friday and rallied hard at the end of the week. Due to the holiday, liquidity was exceptionally thin with many market participants gone for the long Easter weekend. So we did not see cable break resistance as many bulls may have expected. This puts me at pause. When the markets open on Tuesday, expect to see the USD weaken as traders come back from holiday and react to the U.S. jobs report. However, will this stick? Personal income and average hourly earnings still rose last month. According to ISM, manufacturing prices increased last month too. Unemployment claims also dropped significantly despite the slow down in hires. While the market starts to reprice The Fed’s interest rate hiking cycle I fear the market may be getting a little ahead of itself. There is still good reason for the FOMC to still raise rates and as early as June.

GBPUSD DAILY CHART

The daily chart now supports a bullish rally above 1.50. Momentum on the RSI is very constructive. Though still below 50, it seems that momentum bottomed out at the lows of last week. Friday’s rally moved momentum to new highs indicating that GBP/USD bulls will be in control to start the new trading week. Because the dovish fundamentals for the GBP, buyers will have a tough time moving to new highs. If price does break above 1.50, we will need to see confirming action into next week’s trading to really see that the pair is ready for a sustained bullish run.


This is an excerpt from this week’s issue of Quid Report. Subscribers receive my research on all major GBP pairs at the top of the week, including access to @faithmightfx on Twitter for daily, real-time calls and adjustments to the weekly report. AVAILABLE NOW.
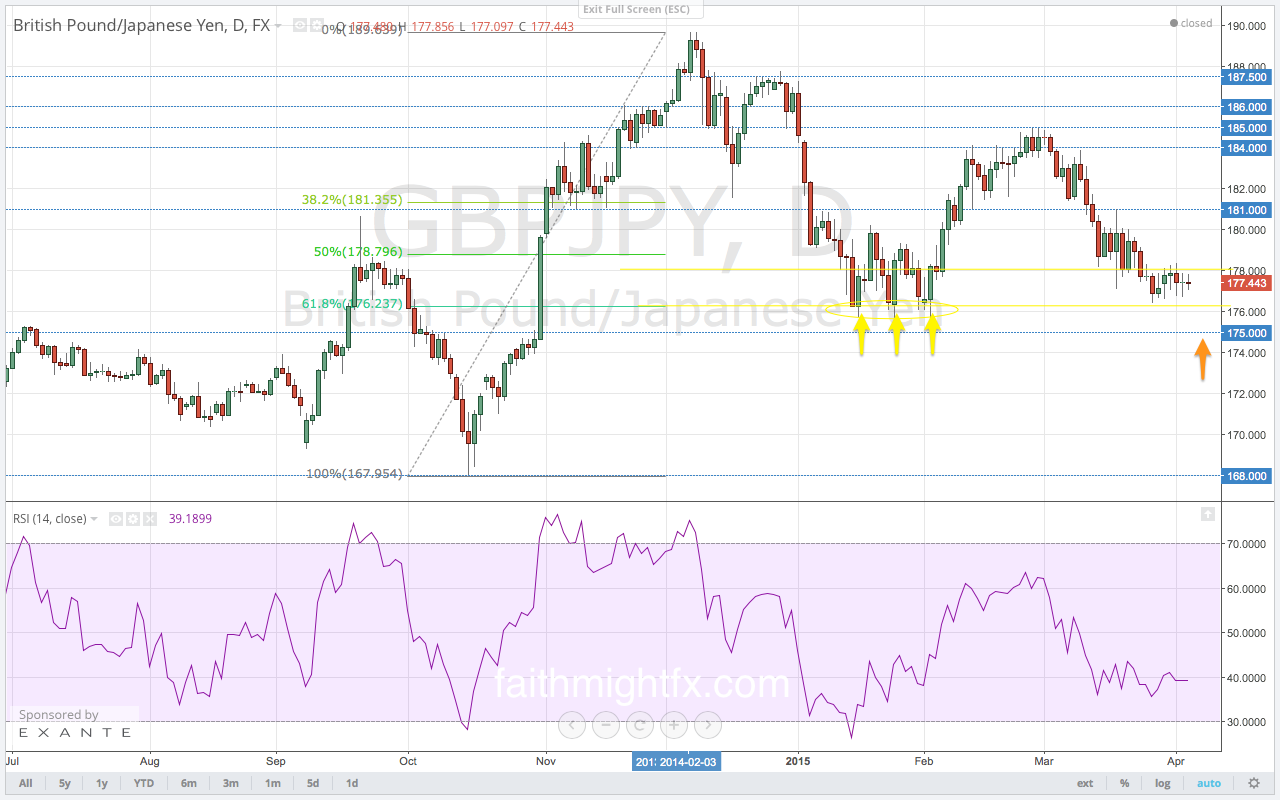
CHART OF THE WEEK: EURO HERO

Each week, I’ll highlight a chart out of the Quid Report.

This week it is the $EURGBP 4-HOUR chart. Everything about this pair screamed for more weakness at the top of the week. And it was bearish until about 8 hours ago. And this chart suddenly came into play. The reasons why are posted on the feed. I love these markets.


EURGBP 4-HOUR CHART


Subscribers receive my research on all major GBP pairs at the top of the week, including access to @faithmightfx on Twitter for daily, real-time calls and adjustments to the weekly report. SIGN UP AND RECEIVE A FREE TRADING BOOK AVAILABLE NOW.

Pay Attention to Risk

I asked the question as the week closed on Friday.

For all the geopolitical stress on markets right now, it is no wonder that USD weakness can’t get a foothold in cable. Looming in the background are many geopolitical risks at play. War is waging, energy markets are changing, deflation won’t go away, and yields won’t go higher. Elections around the globe have created shifts in fiscal policy. We see that with Greece. Nigeria voted in a new president and a change of government over the weekend. The U.S. will do the same next year. While equities have remained at highs, perhaps markets are getting a bit more cautious and risk averse. This undoubtedly helps the U.S. dollar along with the Japanese yen and the Swiss franc – our traditional safe haven currencies.

If USD strength is to really breakout, versus the GBP in particular, price will need to break and close 2 CONSECUTIVE candles below the support zone between 1.4750-1.4800. We’ve been faked out before.

GBPUSD WEEKLY CHART

While the recent lows were a breakout below support, we got an immediate weekly close back above the support zone. With the bullish divergence here, it looks like a false breakdown may be in place. We’ll get our confirmation this week especially with the economic releases due out this week. IF price holds support, this will be a bullish signal worth taking advantage of.


This is an excerpt from this week’s issue of Quid Report. Subscribers receive my research on all major GBP pairs at the top of the week, including access to @faithmightfx on Twitter for daily, real-time calls and adjustments to the weekly report. IF INTERESTED, SIGN UP NOW AND RECEIVE A FREE TRADING BOOK. AVAILABLE NOW.