$GOOG has found support at 1001.23 on the 29th of October. The bears have been in charge of this stock since the first week of September. Price action this year shows support level at 1001 was not broken. Share price of $GOOG fell about 3.5% this week. Since a major downtrend began in October, share price of $GOOG has dropped 14.2%. Price has maintained the lower region of the Bollinger bands since September. It’s like all the gains of $GOOG in 2018 were lost between September and October.
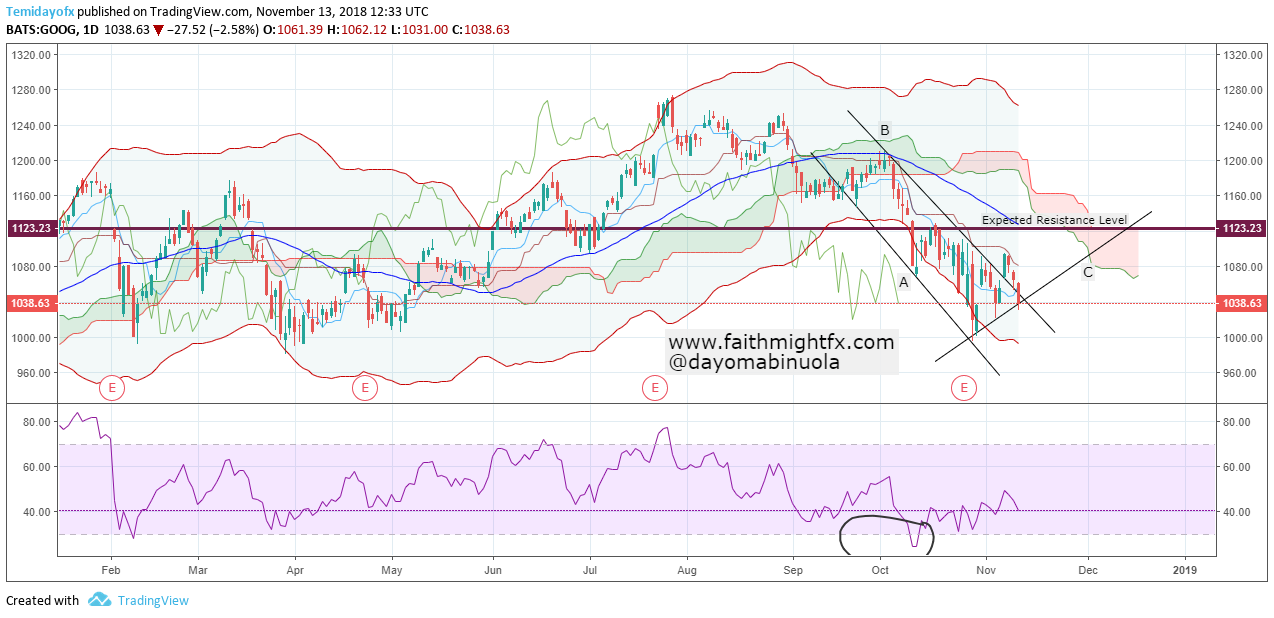
RSI on the daily chart signals an oversold region. Taking a look at the trendlines And B, price closedabove the trendline B on the 7th of November. Presently, price is retesting at a major support indicating a reversal. Price might touch the resistance level at 1123.23 this month. Ichimoku shows a downtrend and no trace yet. If price retraces but holds the expected resistance level at line C, $GOOG may continue the downward trend.