fbpx

USDJPY Broke Support Level After Weeks In Range

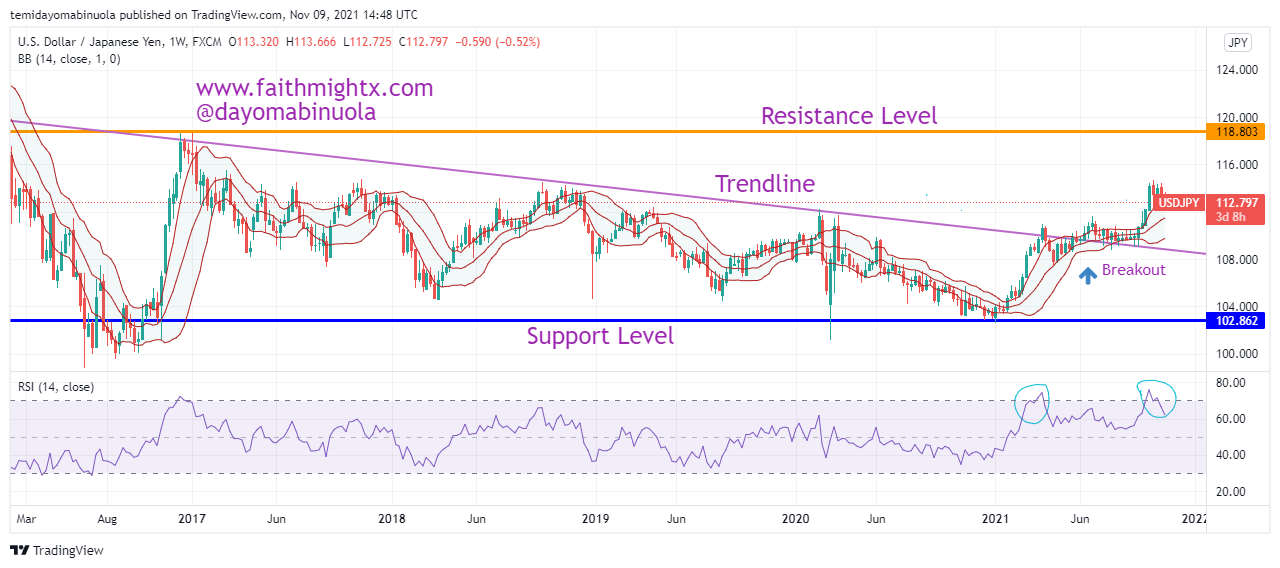
In October 2021, the $USDJPY pair closed above 113.830 since November 2018. Price closed at the highest level in the last 3 years at 114.358 on the 19th of October. $USDJPY has maintained its price around 102.862 since 2016. On the weekly chart, there are above 5 times in the last 5 years that price tried to touch and break the support, but it eventually led to a bounce. The most recent bounce occurred between December 2020 and January 2021. It has all been bullish for the $USDJPY in 2021. The trendline has been drawn from 2016 to 2021, which shows there is a breakout to the upside. This breakout of the trendline occurred in June 2021. RSI on the chart still shows that the price has been overbought in two different cases. Will this lead to price reversal?
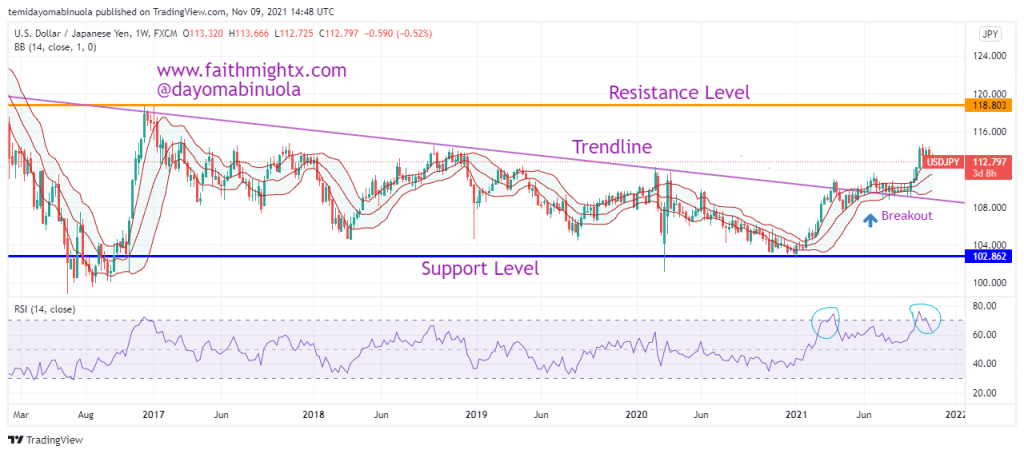
The 4hr Chart has shown that price maintained a support level at 113.253 since a breakout to the upside occurred in the first two weeks of October 2021. Price has been raging between 113.253 and 114.655. The support level was broken to the downside this month. The breakout might be a fakeout, as the price is beginning to consolidate as USD has been gaining against JPY in the past few days. The price might appreciate to 113.690 in the coming weeks from its current 112.904
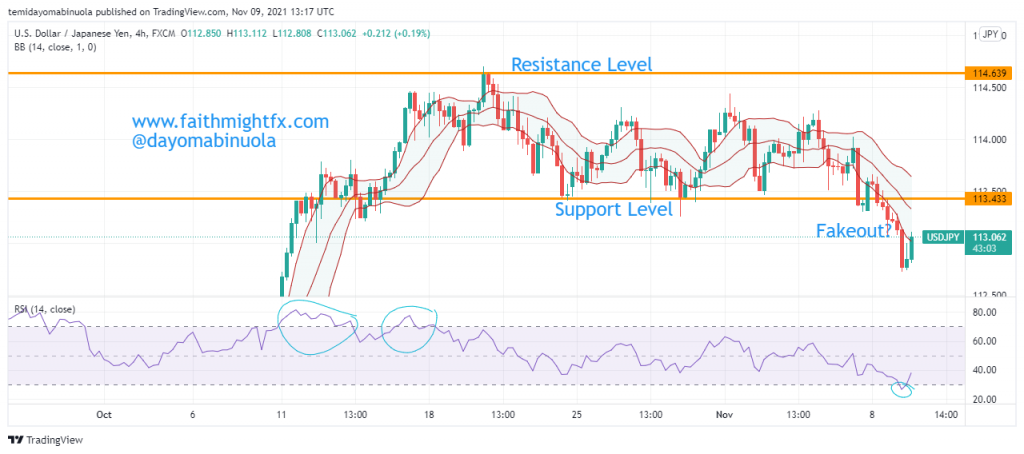
EURJPY Price Failed To Touch The Previous Resistance Level

$EURJPY’s price at the beginning of the year was 126.046 and the price was able to reach the highest level at 134.083 in June 2021. A double bottom has been formed between the months of August and September of this year. This double bottom activated the rally of $EURJPY with the current price at 132.618, 350 pips less of the previous major resistance level at 137.545, which was last seen in February 2018. The highest price of $EURJPY in the last decade was at 149.838. The Euro seems to appreciate more against the yen since the lockdown. Nevertheless, Japan and many countries have vaccinated more than 50% of their population. 

In recent times, there has been an increase in the demand for labour and skill in Europe. This was as a result of the lockdown, as many foreign skilled people are relocating to Europe. Before the dip in August and September of this year, which resulted in a double bottom, RSI showed that the price has been overbought in May 2021. At the moment, the price is already overbought on the daily chart. This could lead to a possible reversal in price as a Doji was formed yesterday and today’s candlestick shows a bearish one. If the price closes with a bearish candlestick and the next few days close on a bearish note, the price might fall to 129.261.