fbpx

The Aftermath of NO Vote

So the United Kingdom has avoided divorce and remains united after all as the Scots voted against independence last Thursday. The market has responded with massive sterling strength across the board. In fact, we have breakouts in the $GBPJPY, the $EURGBP, and the $GBPNZD as the weakness in the cross currency serves to exacerbate these rallies.

The $GBPUSD, however, may not rally like its cross pairs. This relief rally in cable is still a corrective rally and will likely meet resistance at the 1.6750 resistance level. Furthermore, there is confluence at this major level as the 61.8% Fibonacci level of the entire decline also falls at this level.

GBPUSD DAILY CHART

Before the 1.6750, I’d expect offers to come in at 1.6500 and 1.6620, the 50% Fibonacci level. But it is the 1.6750 level where bulls will ultimately have to prove themselves.

Trade what you see.

The Scottish #IndyRef

IMG_4150.JPG

My first reaction was that market doesn’t care about my take so why would I have one. Each day, I attempt to approach the markets with humility because I don’t want to fall in love with a bias that will beholden me to a position. But if I’m really honest with myself, of course I have a take on the referendum!

I don’t think the Scots will go through with it. And if I’m right the market will flail about for a few hours, or days, and go back to trading the status quo. And the stays quo is that the economy is not as strong as it was a year ago. Wage growth, the new forward guidance, is tepid at best. No matter what Carney says, I don’t think he can convince a majority of the MPC to raise internet rates until there is more proof of inflation beyond house prices. In fact, the weakness in commodities actually buys the BoE some time as energy prices are even less of a drag on inflation than they’ve ever been before.

If the Scots prove me wrong and vote in independence, then the pound sterling will weaken fast and sharp across the board. A currency crisis will literally materialize in a matter of hours as markets deal with a sudden GBP currency union or a new Scottish currency.

So, in conclusion, my take is bearish GBP. But I know the markets can do whatever they want to do. So whatever you do with this “insight”, please do mange your risks appropriately and trade what you see.

Read also:

Image credit

Something Had To Give

Last week was a seemingly anti-climatic week. The $GBPUSD had wild swings in both directions only to really have gone nowhere. It ended the week slightly lower. The $EURGBP has broken lower but no follow through yet. $GBPJPY is also lower after it failed to make a new high after its correction but no new lows. The $GBPNZD broke its range to the upside only to be capped by the larger 1.9750 resistance level.

As the new trading week opens, sterling is on the back foot. Last week’s lackluster was indecision and the market can only remain “stuck” for so long. Something has to give and something always does. But GBP is a mixed bag. While the rally in the $GBPUSD has given way to risk for a bigger sell-off, the $GBPNZD looks poised to move higher.

GBPUSD DAILY CHART

GBPNZD DAILY CHART

The $GBPJPY has also bounced nicely off the lows.

GBPJPY DAILY CHART

And the $EURGBP has become a battleground between $EURUSD weakness and $GBPUSD weakness.

EURGBP 4 HOUR CHART


The release of the Bank of England minutes, retail sales and Q2 GDP this week will either sink or boost sterling. If the minutes reveal any hawkish hints, particularly any votes for a rate hike, any chance for a correction are over. However, if the minutes turn out to be another non-event, retail sales and GDP become much more important. I think it would take a miss in both those releases to turn the tide on sterling. Watch the charts. Mind the calendar. Trade what you see.

The Sterling Digest, 11 July 2014: stalling

Stock market cartoon from Twitter
Bulls are stalling

Advancement in the GBP trend has stalled this week. Manufacturing and construction data missed this week and the Bank of England’s hold on monetary policy turned out to be a non-event. Sterling weakened briefly on the policy announcement but momentum never really took hold in either direction. Dips were bought but highs were also met with enough offers to keep price capped for another week. This stalling, sideways action is simply consolidation of the bull rally that has gained strength in the past month. Now as the 1st full week of trading of the 3rd quarter comes to a close, sterling remains in a tight range. Despite the tepid price action this week, sterling remains fundamentally strong. Between the US Federal Reserve and the European Central Bank, the BoE looks tremendously hawkish. Until that contrast changes, it is enough to keep sterling supported long term.

Image credit


All According to Plan

It’s nice when a trading session goes according to plan. Retracement levels were tested yesterday as sterling consolidates recent gains ahead of Thursday’s Bank of England announcement. We started the week with these charts. We staked out our levels. But it is not enough to make a plan. You have to have some conviction to put your orders on too. It doesn’t pay, if you don’t play. Position-sizing is a very underappreciated skill. It takes more discipline than you would imagine to establish a position in the market with the correct size. Too big a position and the risk may take you out before you can earn the reward. Too small a position and the reward just isn’t as satisfying for your account balance. I find that by scaling into a position, you can spread the market risk across multiple, smaller trades maximizing the best price the market is giving. Once we determine our position, the hardest part of executing any plan is the action of inaction – we wait.

We didn’t have to wait long. Thanks in part to lower-than-expected manufacturing and industrial production releases, GBP fell across the board yesterday. Days like yesterday, you don’t have to do anything. Just watch price. In fact, if you are planning each trade and trading each plan, you should experience more days where you are simply watching price move at the market’s will. When it’s too tempting to watch price action, leave the screens or risk trading carelessly.

After yesterday, we are headed into FOMC with all the charts still in play. $GBPNZD breached its Fibonacci levels so only support at 1.9350 matters to the downside on more consolidation. All other charts ($GBPUSD, $EURGBP, $GBPJPY) stand. Markets will be light and choppy waiting for the 2pm EST release time. Be aware that some market participants will take advantage of lighter flows and size up their positions. When central banks come to the stage, it is the larger timeframes that really keep you focused on true supply and demand in the market.

Game on. Trade what you see.

Read also:


More Dips, Same Trend

Our first full week of the new quarter and we are greeted to a correction in GBP across the board. With the Bank of England rate decision this Thursday, price action today indicates tons of positioning as market participants take profits and set orders ahead of the announcement.

GBPJPY DAILY CHART


GBPNZD DAILY CHART


EURGBP DAILY CHART


$GBPUSD chart: Healthy Dips Make for Healthy Trends (FMFX)

Trade what you see.


The Sterling Digest, 13 June 2014: SURPRISE!

Bank of England
BoE preps market for rate hikes

Bank of England Governor Carney has just shocked the market signaling that interest rate hikes could come sooner than the market expects. GBP has skyrocketed across the board on these comments and it should. I just sat in with FXStreet’s Dale Pinkert on Monday saying that UK fundamentals remain strong but I believed that sterling would take advantage of the low volatility and summer trading doldrums to consolidate further. I didn’t think Carney would rattle markets until the August Inflation Report. Instead, he is well ahead of schedule and has put sterling back on track to reach new highs across the board. Already, $GBPUSD has probed 1.7000 and $EURGBP has broken below 0.8000.

Image credit

Today’s Appearance in FXStreet’s Live Analysis Room

It was great to be back in the #FXRoom today with Dale Pinkert. As always, we talked all things sterling including $GBPUSD, $EURGBP, $GBPCAD, $GBPAUD, $GBPNZD and $GBPJPY and the recent behavior in these low volatility markets.

As I told Dale, watch how sterling behaves this summer. I suspect we start to get more definitive moves after the summer doldrums.

Check out my previous appearances:


The Week Ahead In Charts

Last week, Janet Yellen changed the game. This supposed uber-dove fooled us. She came out hawkish without really rattling markets. She is reigning in the USD. Contrary to those that say she’ll retract later, markets may come to find out that Yellen is serious. She is much more hawkish than the market ever expected. Can the USD strengthen on this change?
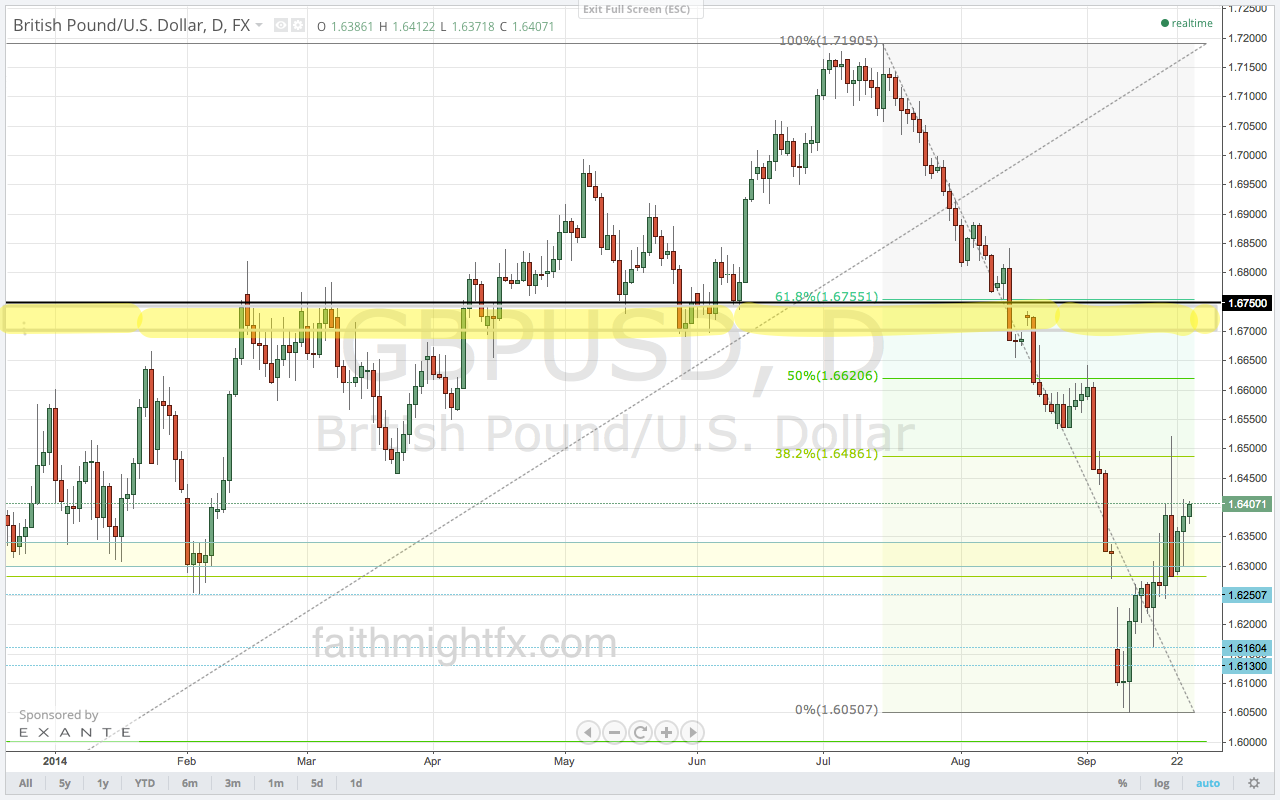
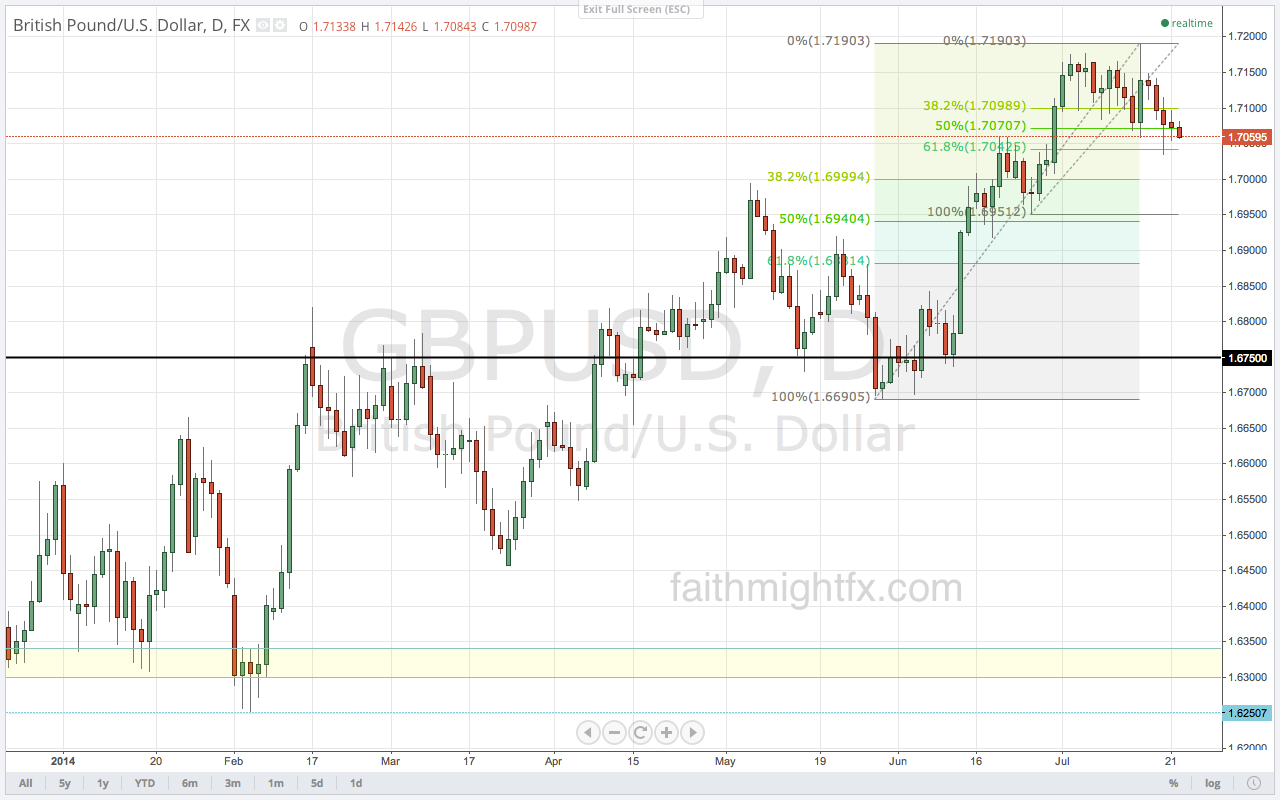
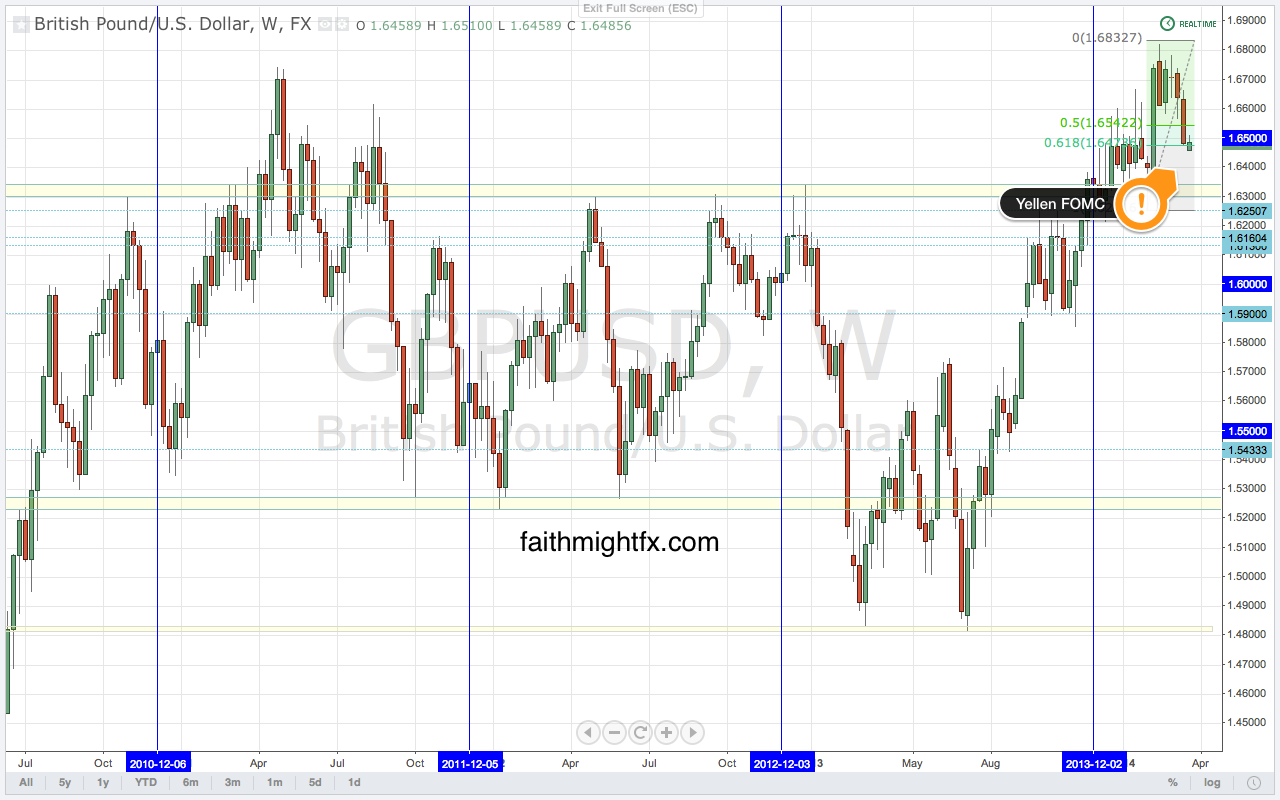
GBP/USD

$GBPUSD declined last week to 1.65 even breaking below the big psychological level on the back of Yellen’s hawkish rhetoric last week. The technical picture looks broken as cable closed the week below 1.65 for the 1st time since January. Price breaks the 61.8% Fibonacci level at 1.6467. It looks like another failed breakout on the weekly chart. Just when cable had everyone yelling for 1.70 (even yours truly), markets once again make a sucker out of everyone. If $GBPUSD is unable to find support above 1.6500, this would signal a reversal back to 1.6250. Is the Yellen spark enough to break that level? That’s the more interesting price action for market sentiment. And the Yellen FOMC just became the 1st central banks to raise interest rates AND remove QE.
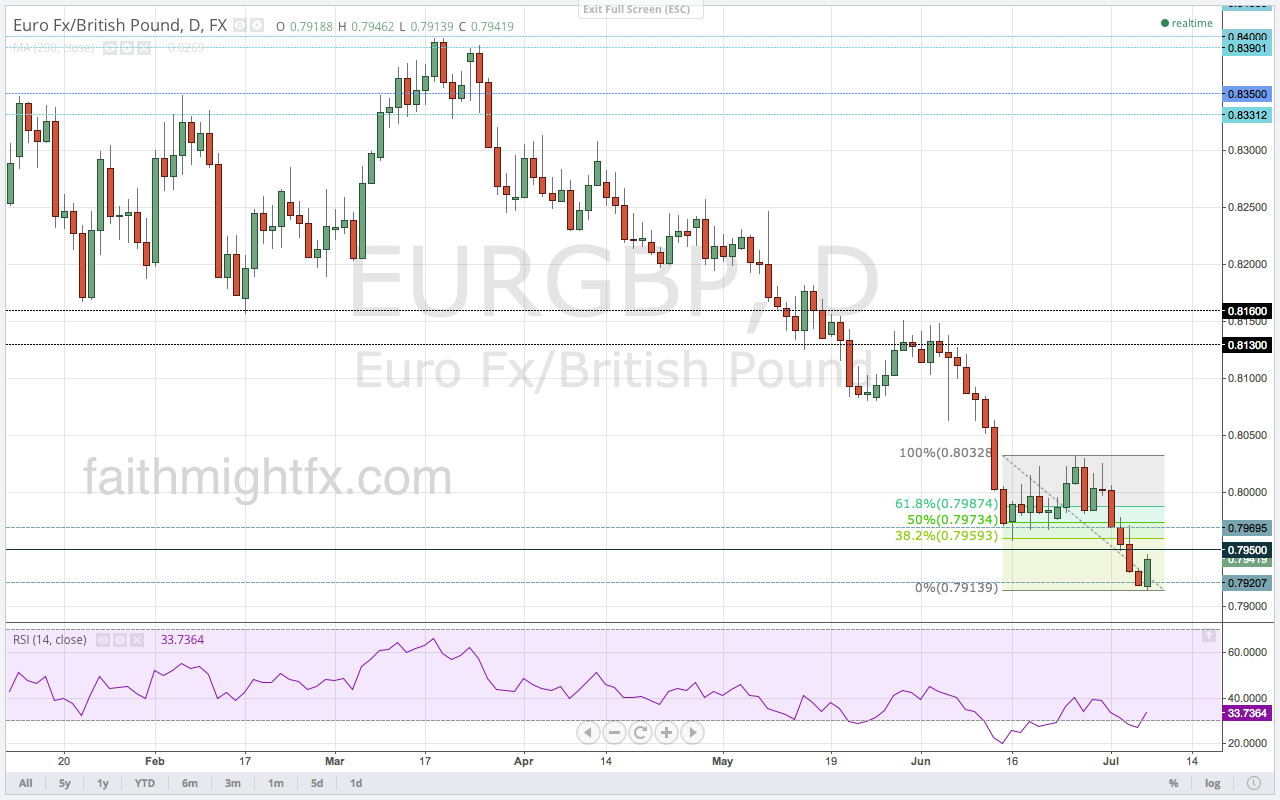
GBPUSD WEEKLY CHART

EUR/GBP

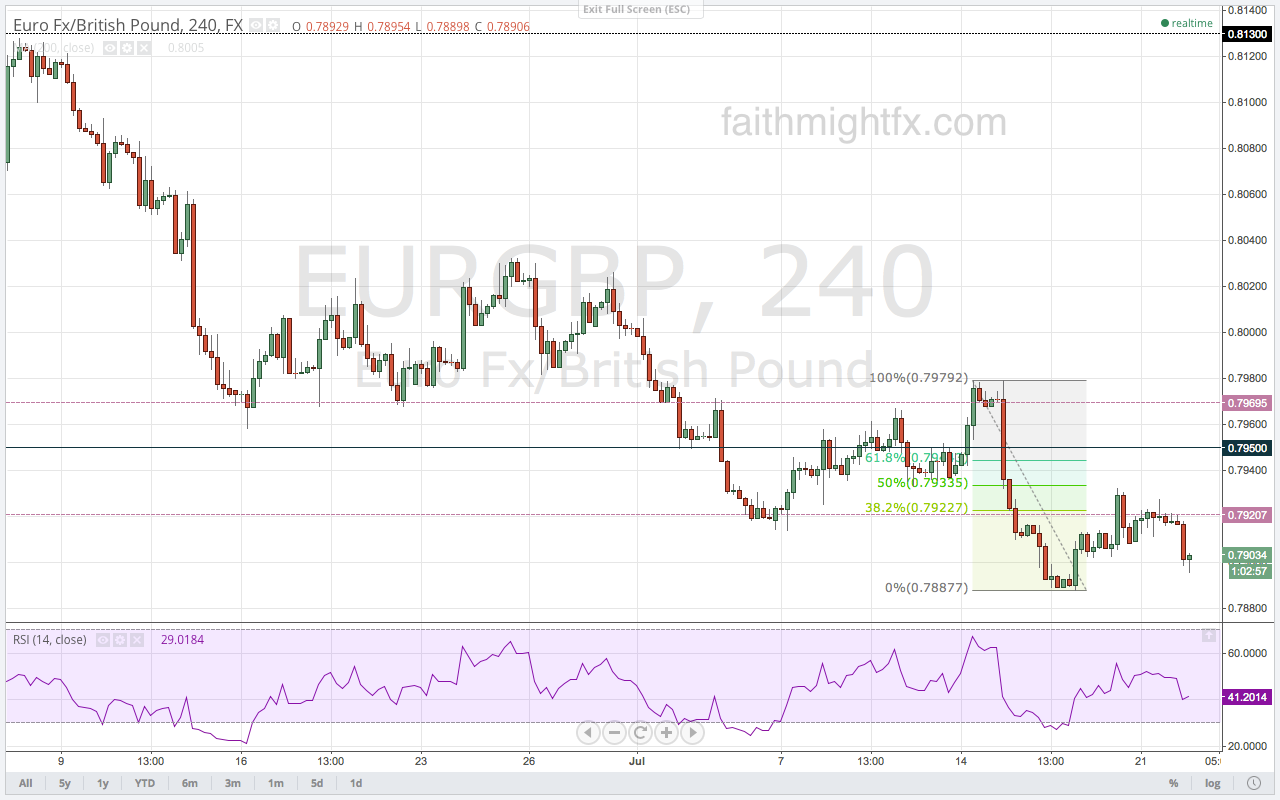
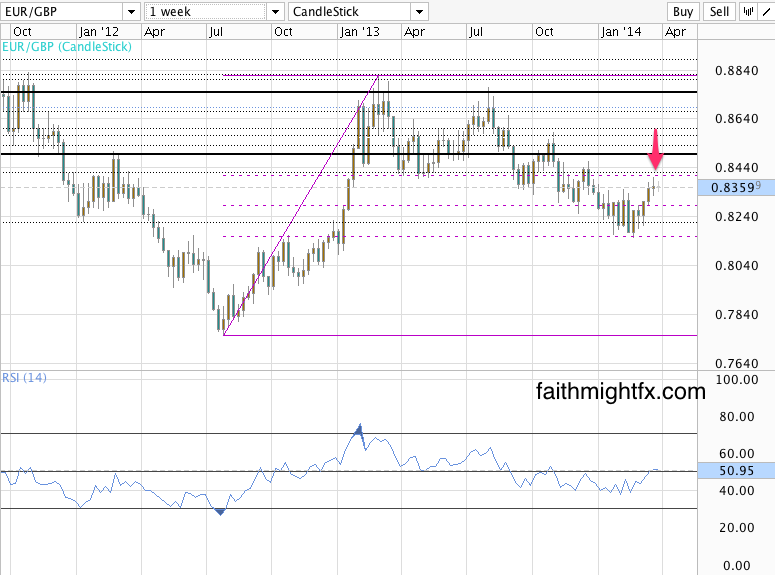
The $EURGBP has managed to stage a rally higher than expected finding resistance right at the 0.8400 level. Price now remains trapped in a range between 0.8330 and 0.8400. However, it seems that the EUR will find difficulty rallying in the face of weak economic data and a still dovish ECB. If price breaks below 0.8330, losses could accelerate back to the 0.8250. But it remains to be seen how much EUR can really rally on its own fundamentals. This may be the only currency that sterling can rally against. If 0.8250 holds then we’ll be back to these levels again with resistance at 0.8400.

EURGBP WEEKLY CHART

GBP/CAD

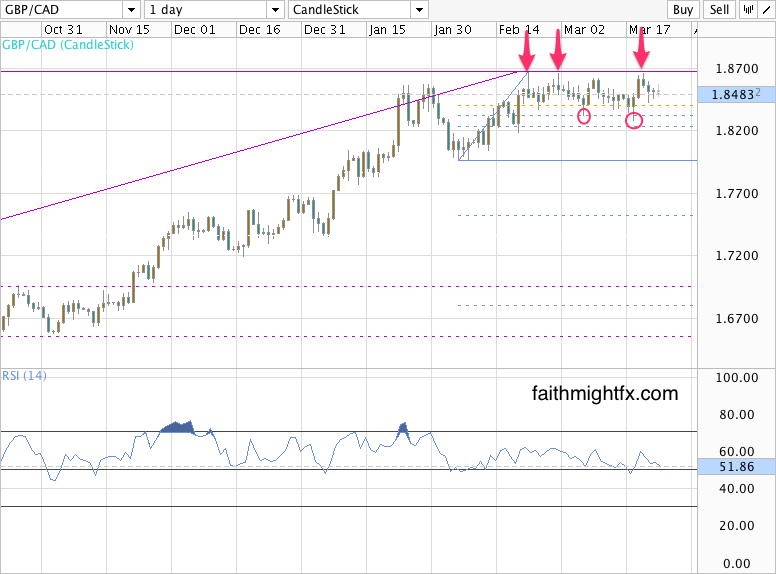
Canadian data continues to support a weak CAD which only continues to support the $GBPCAD at its 2014 highs. However, this pair is having a difficult time breaking any higher above 1.8650. Price continues to pivot around 1.8500. The fundamentals in this pair continue to favor the bulls. But can it really rally when GBP is weak in all the other pairs. I’m not so sure.
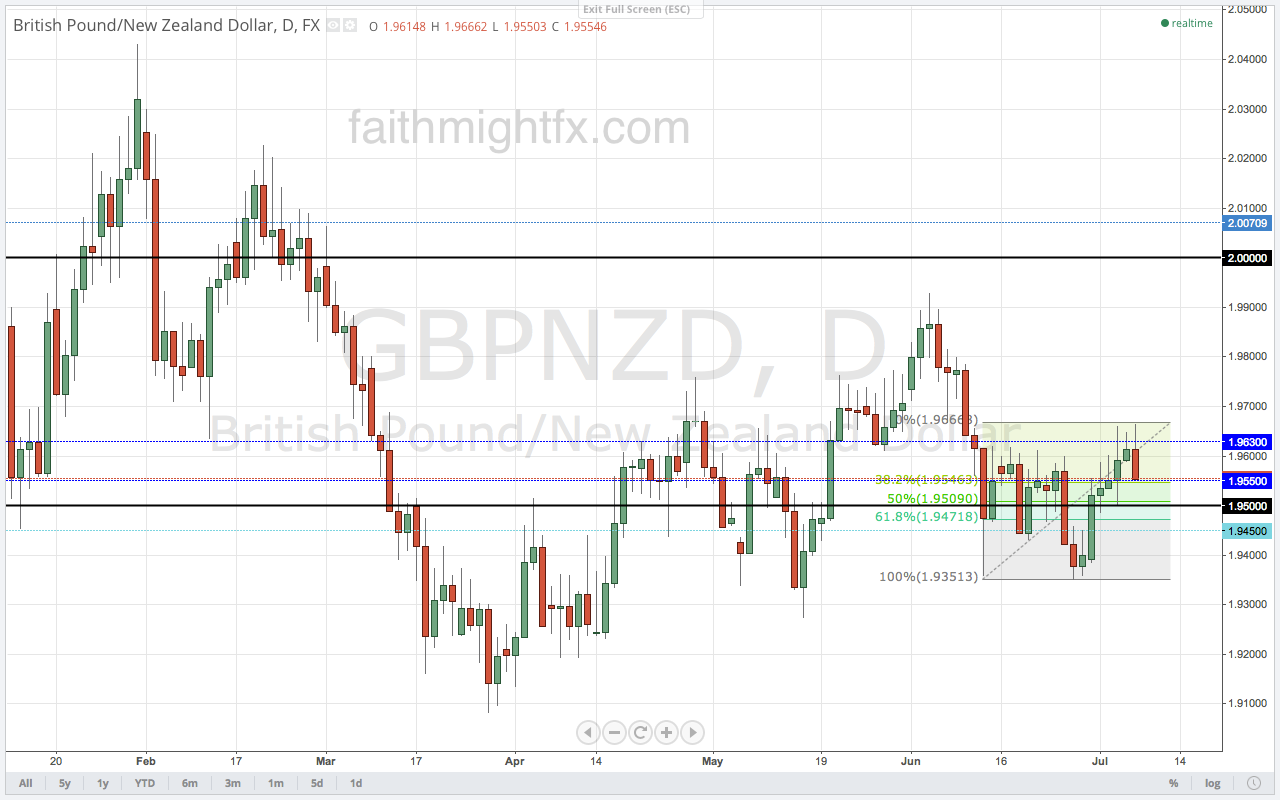
 GBPCAD DAILY CHART

GBP/NZD

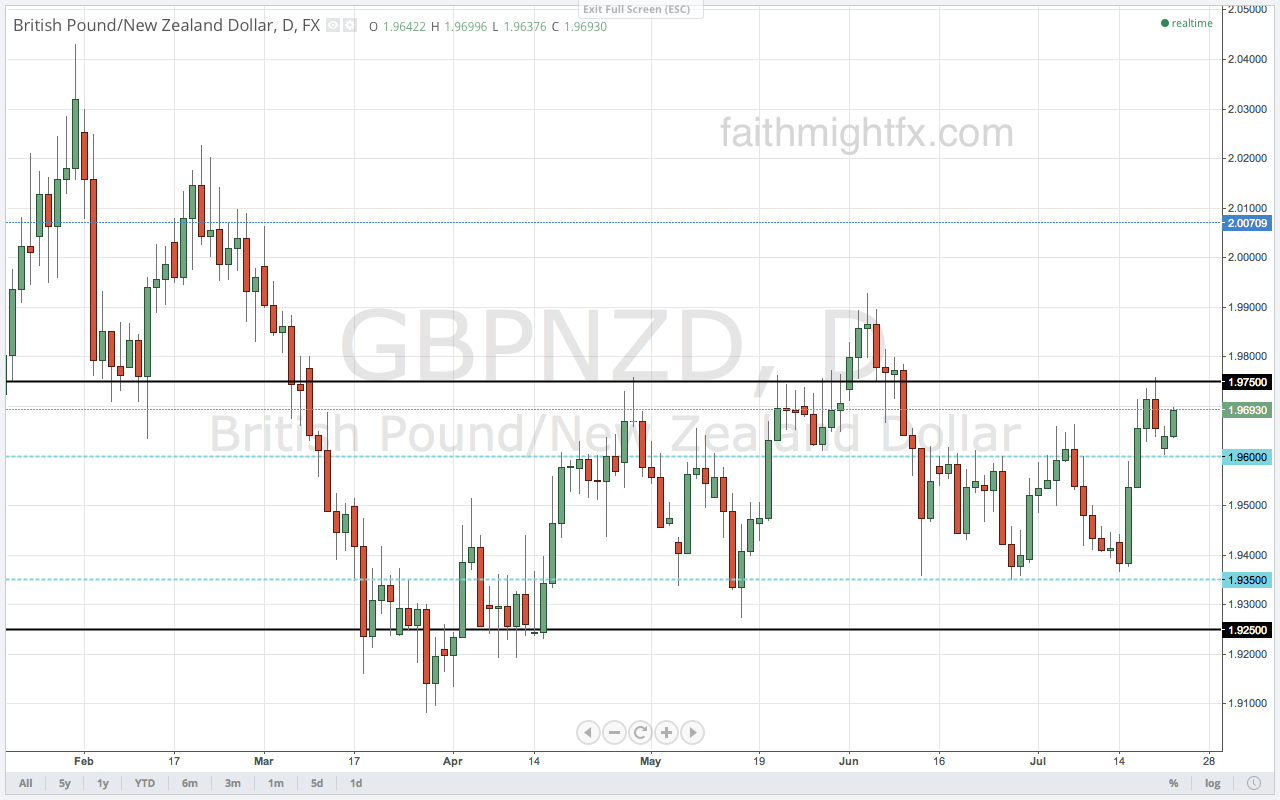
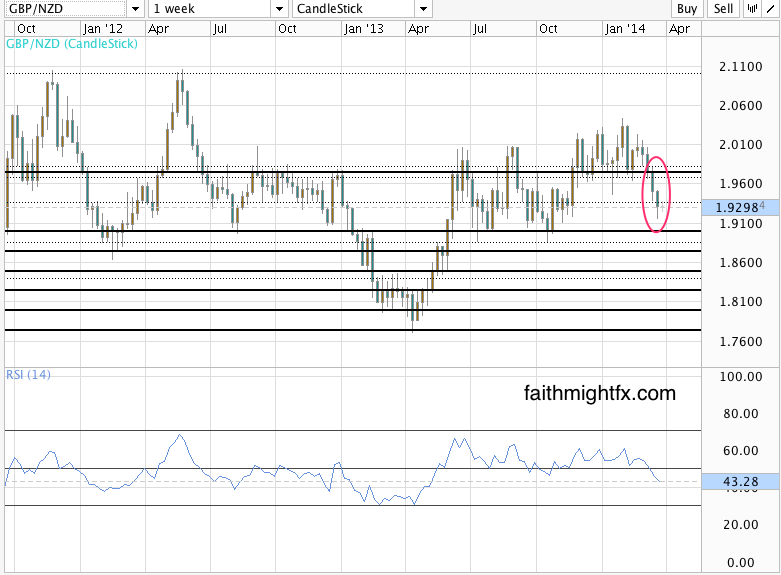
There has been a major breakdown in the $GBPNZD causing a reversal on the daily chart. During the consolidation of the $GBPUSD, the $GBPNZD was holding up quite well in its own consolidation. But the effects of the Ukraine-Russia conflict have sparked a rally in commodities and with it the NZD. As such, the correction that was taking place in the $GBPNZD and finding support at 1.9500 broke down further last week. Price managed to completely reverse this year’s rally moving to back to lows on the daily chart. The level to watch is 1.9100. A break below  moves prices toward 1.9000 with major support at 1.8850. However, if price finds support at 1.9100 then it moves back to 1.9500. Watch out also for intervention from the RBNZ if the NZD continues to find strength.

GBPNZD WEEKLY CHART

GBP/AUD

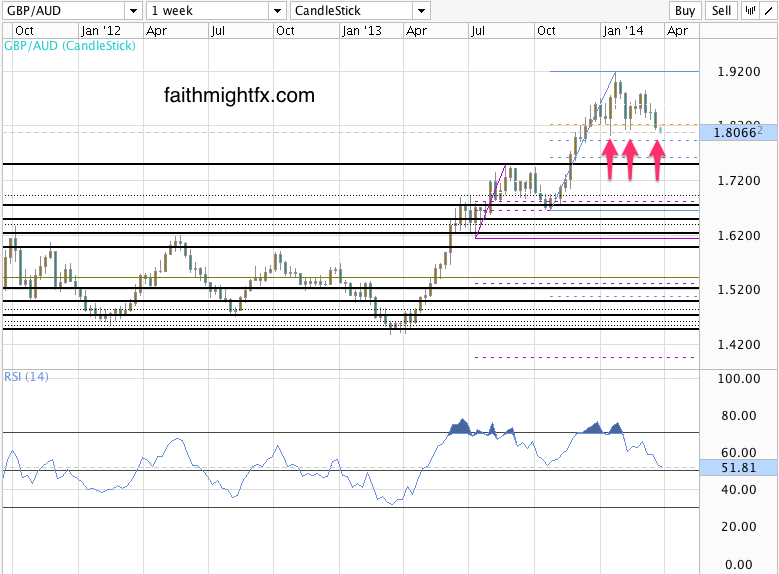
The $GBPAUD is benefiting even more from the rally in commodities even as the Chinese economy, Australia’s biggest trading partner, continues to slow. There is also a massive head and shoulders chart pattern on the daily chart that many traders are looking to resolve to even lower levels. Based on this chart pattern, price could decline to 1.7600 which is the huge 61.8% Fibonacci retracement level on the weekly chart. Even a 400-pip decline from current levels wouldn’t change the bullish bias on the long term chart. But will the RBA allow the AUD to strengthen that much? RBA intervention is a real possibility if $GBPAUD breaks this support at 1.8000.
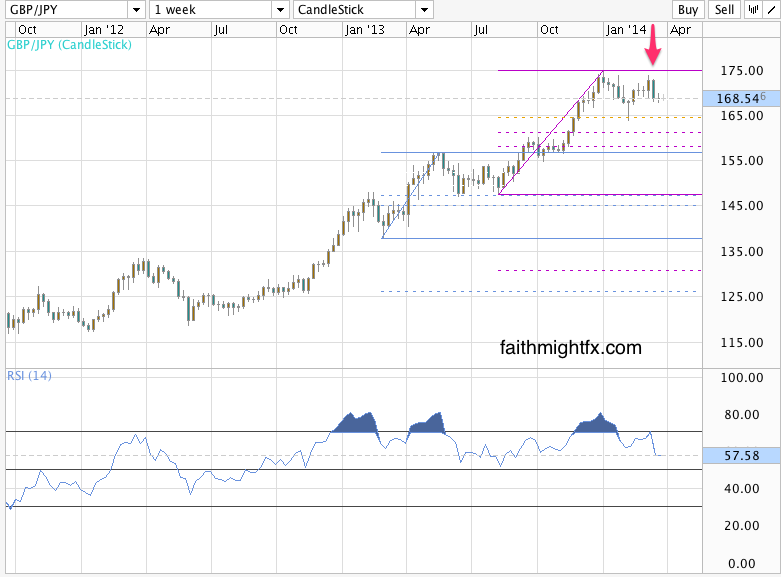
GBPAUD WEEKLY CHART

GBP/JPY

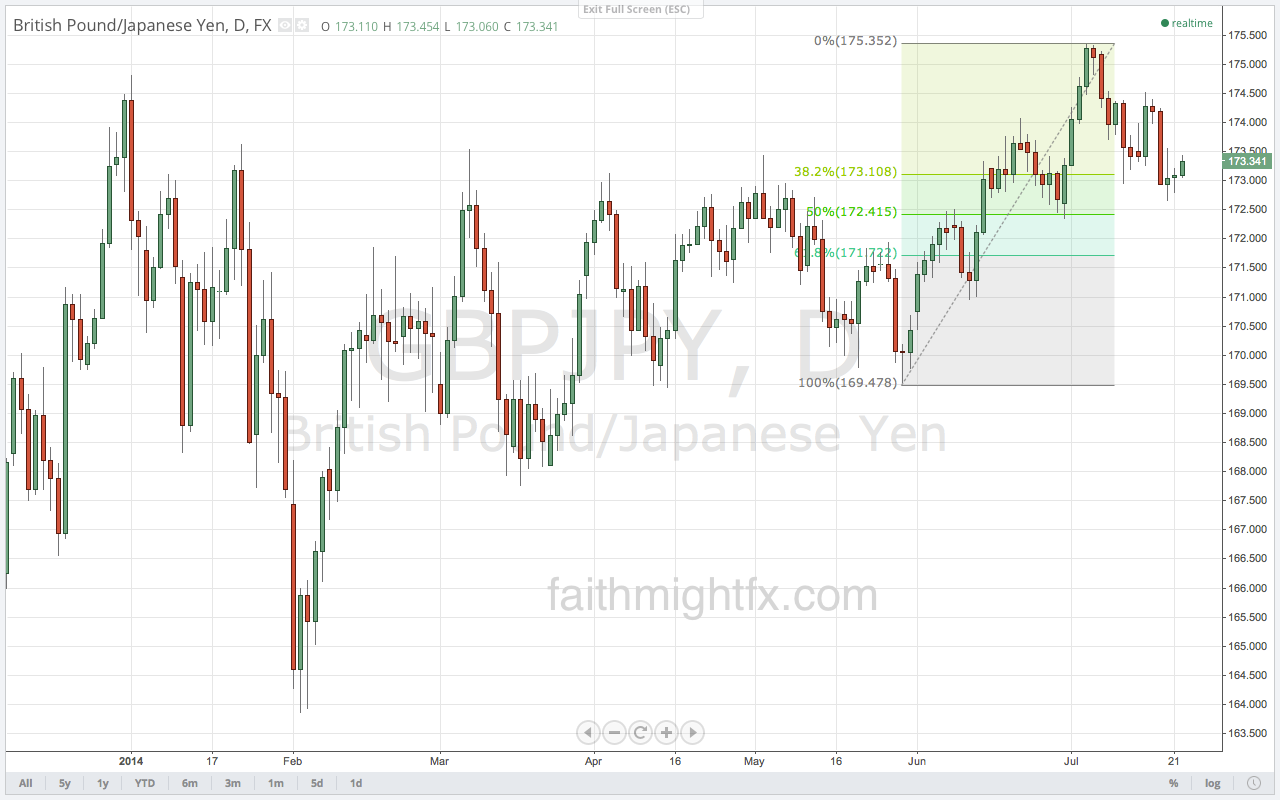
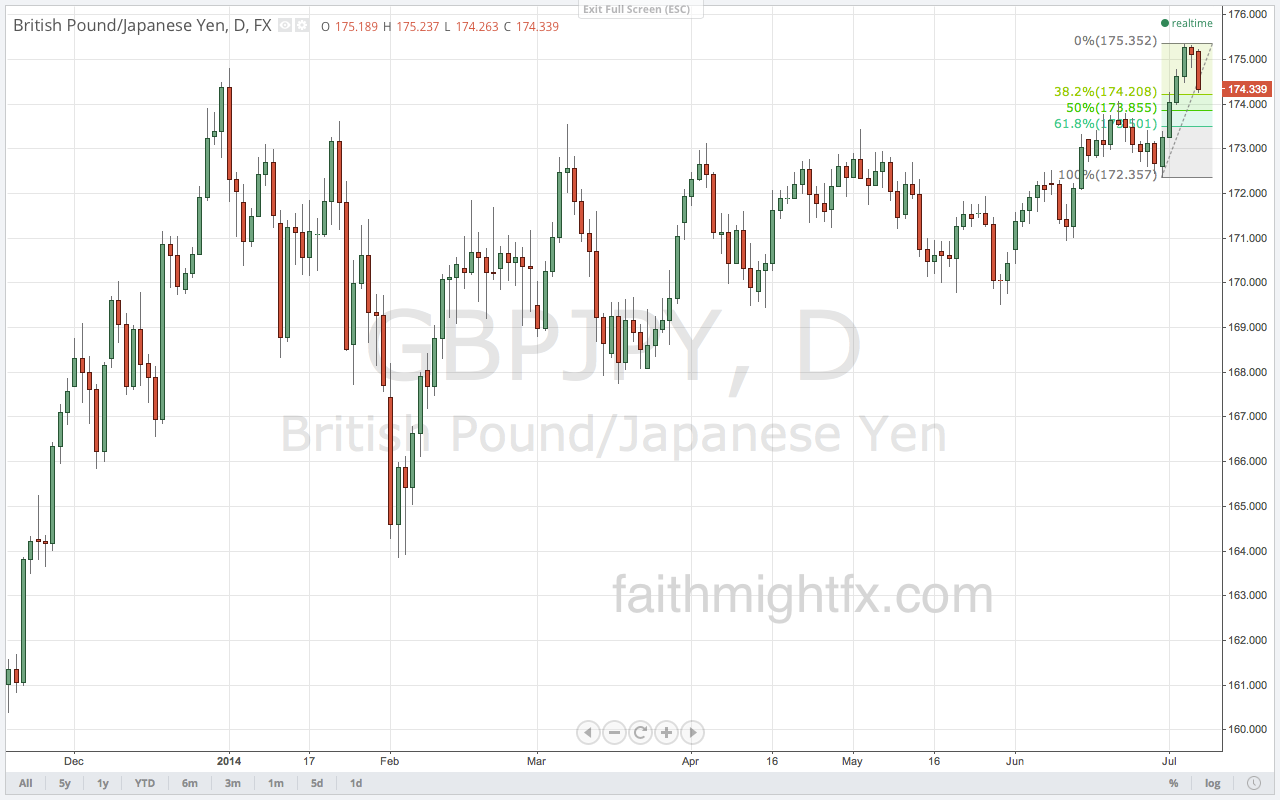
Despite the bull trend on the daily chart, $GBPJPY has fallen below the big psychological level at 170.00. Even while the pair is finding support at 167.50, a break below 167.30 signals a price move to 163.80/164.00 support. Only a close back above 170.00 can change this new bearish sentiment in the $GBPJPY. A move lower will be choppy as the bull trend no doubt still has many buyers  with the $GBPJPY still only in a shallow retracement.

GBPJPY WEEKLY CHART