fbpx

Sterling Digest – crosses firm up

Yesterday, $GBPUSD fell to new lows just pips ahead of the 50% Fibonacci level at 1.6536. It was the move many of us had been waiting on for weeks. Now that the consolidation in $GBPUSD is finally over, I believe we will see GBP resume its rally in many of the major pairs. The UK fundamentals have been there and the strong recovery is its reality.

GBPUSD vs EURGBP comparison on 4hr chart

However, what is interesting is the reversal that is beginning to confirm itself in the comm doll pairs. I expected these pairs would weaken to key support levels. However, this week, for the 1st time in months, those support levels are being broken. We may be on the cusp of D-Day where swing buyers start to sell and bail out of the market. OR. It could be an incredible buy opportunity because of the BoE minutes and FOMC announcements this week.

  • The BoE minutes are out and they are hawkish. (eFXnews)
  • I saw it too but it never counts unless you publish. These guys were 1st to show this incredible H&S in $GBPAUD. HUGE level. (Twitter, Factor)
  • The $GBPNZD put in a huge level too. While I thought 1.95 was key, 1.9150 proved to more significant. (Twitter, FMFX)
  • Raising interest rates vs. tapering QE — interesting take (Telegraph)
  • The huge bounce off support in the $GBPCAD this week very nicely reflects a dovish Bank of Canada and overall weakness in Canada versus a hawkish Bank of England and robust UK. (Ashraf Laidi)
  • A review of the $GBPUSD move we have been waiting on all month (FMFX)


The Week Ahead In Charts

GBP/USD

No real change in the last 2 weeks as cable remains rangebound during its consolidation. Price action reminds me of the price action back in October when price finally broke above 1.60. Cable consolidated in a range between 1.61 and 1.59 for that entire month. It wasn’t until price broke down to the then 50% Fibonacci retracement level at 1.5850 that price resumed its monster breakout to new highs above 1.63. I believe that is same price action we have now and price will not resume higher above 1.6820 until we see price fall to 1.6550/00.

GBPUSD DAILY CHART

EUR/GBP

The $EURGBP has finally broken higher above 0.8300 and has moved right into the resistance level at 0.8330. Between here and 0.8350 is a potential sell zone for a move back to the lows at 0.8160. If $EURGBP buyers are to gain anymore traction, there must be a daily close above 0.8350 to signal a sustained move higher to 0.8400.

EURGBP DAILY CHART

GBP/CAD

As Canadian fundamentals continue to deteriorate (Friday’s jobs report showed Canada lost jobs last month), the $GBPCAD will remain bid even as sterling continues to consolidate. The major psychological level at 1.85 remains a level where traders see major positioning for when GBP strength returns. The $GBPCAD has found staunch resistance at 1.86 but still targets 1.90 midterm.

GBPCAD 4-HOUR CHART

GBP/NZD

I’d imagine there is some serious positioning going on in the $GBPNZD right now too. This pair actually had some real movement falling over 350 pips in the past 2 weeks. Price sits at the bottom of this consolidation range as the week opens. It’s a light week out of the UK but the Reserve Bank of New Zealand could surprise markets. Likely more jawboning but geopolitics have changed quite a bit with this Ukraine-Russia situation and commodity prices have firmed. 1.95 is key support into the rate decision.

GBPNZD DAILY CHART

GBP/JPY

The Bank of Japan is set to deliver a monetary policy announcement this week too. The $GBPJPY opens the week at the 172.00 former highs after moving off the new highs at 173.55. A correction lower sees support at 171.50. However, $GBPJPY remains bullish above 170.00.

GBPJPY DAILY CHART

 Compare:

The Week Ahead In Charts (FMFX)


The Week Ahead In Charts

After a week of consolidation in sterling, GBP pairs are a mixed bag as this new trading week gets underway.

GBP/USD

Though $GBPUSD has moved off its recent multi-year highs, it has been a volatile and choppy ride lower. Expect more of the same again this week, as this pair continues to correct lower towards 1.6500. I believe big time buyers are set up all around 1.65 between the 50% and 61.8% Fibonacci retracement levels. A move from these levels supports a rally to 1.7000 mid term.

GBPUSD DAILY CHART

EUR/GBP

The $EURGBP spent all last week struggling at the 0.8250 level. On Friday, however, price broke above 0.8250 and held the level to close the week. While the daily chart is in a clear downtrend, price is holding support at the weekly chart’s 61.8% Fibonacci retracement level. This correction has the potential this week to continue higher to the zone between 0.8330 and 0.8350. From here, it will be decision time. But the odds are with the bears as GBP could catch another bid and push price back to lows.

EURGBP DAILY CHART


GBP/CAD

While $GBPUSD and $EURGBP consolidate, the $GBPCAD price action has remained bullish . Candaian fundamentals keep the $GBPCAD well supported on dips. Dips due to GBP weakness have been bought below 1.8500 as CAD fundamentals continued to deteriorate. For some reason the Canadian economy is falling into recession even as the US, its largest trading partner, has remained robust. This pair will continue to have issues getting higher as long as cable is weak. Once $GBPUSD starts to show strength again, the $GBPCAD should find conviction higher again.

GBPCAD DAILY CHART

GBP/NZD

The $GBPNZD has remained very bullish closing the week above the almighty 2.00 level. As the $GBPUSD continues its consolidation lower, there is major positioning occurring at this major psychological level in $GBPNZD. It has been a whipsaw at the highs but as long as the overall GBP bull trend remains in place, this pair is poised for 2.05 mid term.

GBPNZD DAILY CHART


GBP/JPY

The $GBPJPY has remain elevated as equity markets bounced higher to the 2014 resistance levels. This week, all eyes on US stocks and emerging markets as 2 wars ended this weekend. The stage is set for risk to rally higher as geopolitical events turn towards peaceful resolution. As $GBPJPY opens this week above 170.00, the bullish sentiment favors buyers even as the trend still remains corrective below 175.00.

GBPJPY DAILY CHART

All these charts suffice it to say that sterling is smoking hot. A trend that can correct is only headed higher. And a trend that holds up during consolidation has the makings for a major breakout. $GBPUSD is the pair to guague timing in the GBP crosses during this time of consolidation. Once major levels are reached in cable, sterling may rock out across the board once again. Or not. Price will ultimately tell.

Disclosure: I am long $EURGBP as of this writing since last week.

Sterling Digest, 13 February 2014: phase two

Mark Carney, Governor of Bank of England
The honeymoon is over

Bank of England Governor Mark Carney delivered the long awaited Inflation Report after “scrapping” forward guidance just a month ago. What Carney gave is what some are dubbing stronger guidance. He recognized and upgraded the UK economic recover and then added more indicators to produce “Forward Guidance – Phase 2”. Whatever you want to call it, the markets liked it and sterling rallied hard across the board. The rally continued even during the Asian session as those traders got the opportunity to digest the Inflation Report and Carney’s remarks. Now with sterling at key resistance levels, does it have the strength to go higher? What’s even more interesting to watch is if sterling can continue to rally in the face of a dovish BoE.

Image credit


Sterling Digest, 15 January 2014: WTF

TIME magazine cover of new Fed chairman Janet Yellen
Until her 1st meeting in March, USD may hijack the markets with uncertainty

These 1st 7 trading days have been a nightmare for me with sterling. SHEESH! The market pushed to highs and lows and yet still remains rangebound. The volatility, too, has been intense as players jostle for position in the year open. Nobody wants to miss the monster rally of 2013. Both bears and bulls have been shook out and made money. It hurts but there still a lot of new year left. It is important to admit to the pain, analyze mistakes and make the next decision. Timing has needed to be perfect and fearless. Yet this is always easier said than done. A $GBPNZD short at 2.00 was a beautiful opportunity but the volatility on NFP day shook me and faked me right out of the trade. Other traders have been sharing similar frustrations in the market. Thankfully, there are others still who are seeing very clearly and their shares have been a guiding light to (some) clarity. That is the beauty of the market…and the stream.


(Image credit)


What I Wish I Said

I was honored today to be on @spz_trades’s last show on BFTD.tv with @NicTrades. @NicTrades is a superwoman who chatted markets in the middle of a power outage. She rocks. Some of her key observations for 2014 that I took away:

  • $AUDUSD to 0.9000 off the double bottom
  • $USDJPY to 112
  • USD lower and USD pairs higher
  • $EURUSD to 1.43
  • Correction in $SPX, $DAX and $FTSE
  • Stocks will have to rally on their own merit, not QE

I was clearly the student in the room and now in hindsight there are a number of thing I WISH I could say now. SMH. Face plant. So I’ll say them here.

  • I do see $EURGBP higher to 0.8600. I also still see heading lower in 2014 to 0.8000. It might happen way sooner than I imagined if current price action is any indication.
  • $GBPAUD is due a correction lower. Much lower. But if it were to correct to 1.7670 the 50% Fibonacci level, hold, and rip to new highs at 2.10, it would be the trade of the year.
  • Other great follows right now on Twitter for new traders that I didn’t mention: my traders list

I love that this blog gives me the opportunity to reflect on myself and remain true to who I am. I don’t know if it was nerves (Nic is a rock star!) or because I had company the night before, but I don’t feel like I came off myself today. Hopefully, you all can enjoy listening in on this chat about markets and trading for 2014.

My 2014 Outlook for Sterling

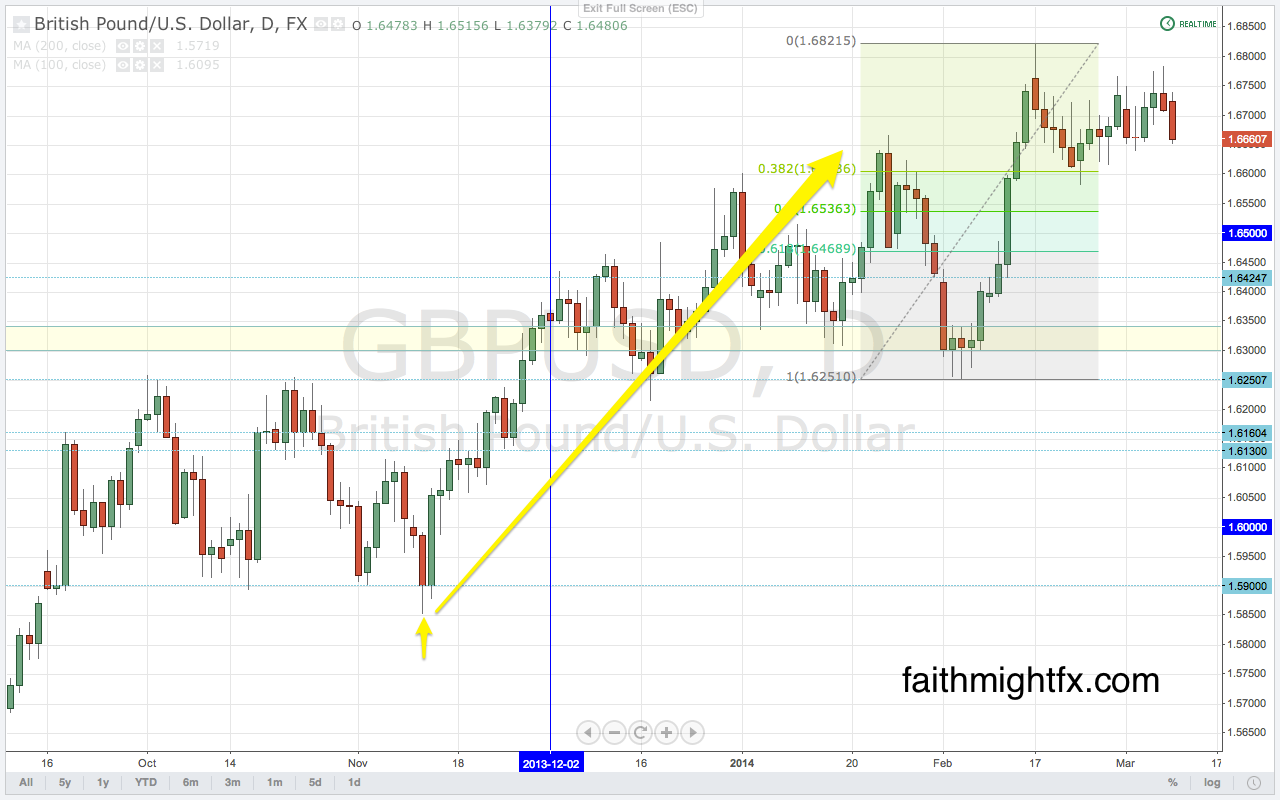
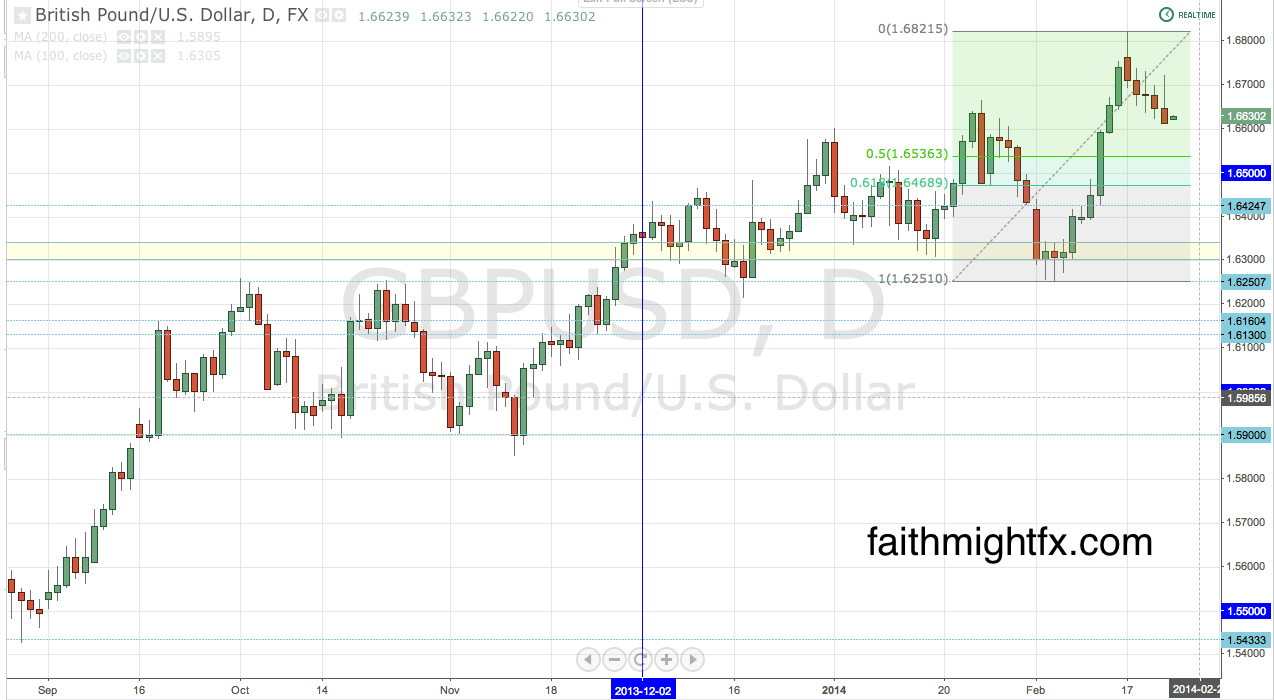
$GBPUSD will start 2014 at highs not seen in several years. Taking out the big psychological level at 1.65 is a big deal and it wouldn’t be surprising to see price move higher on spike rallies. Despite these levels, cable still remains in a range on the weekly chart. Also consider that $GBPUSD has always seen a turn in the long term trend at the new year. For the past 5 years, December has marked a new high or low and then January sees the beginning of a reversal. Seasonality would suggest that $GBPUSD starts to turn lower after the new year.

GBPUSD WEEKLY CHART

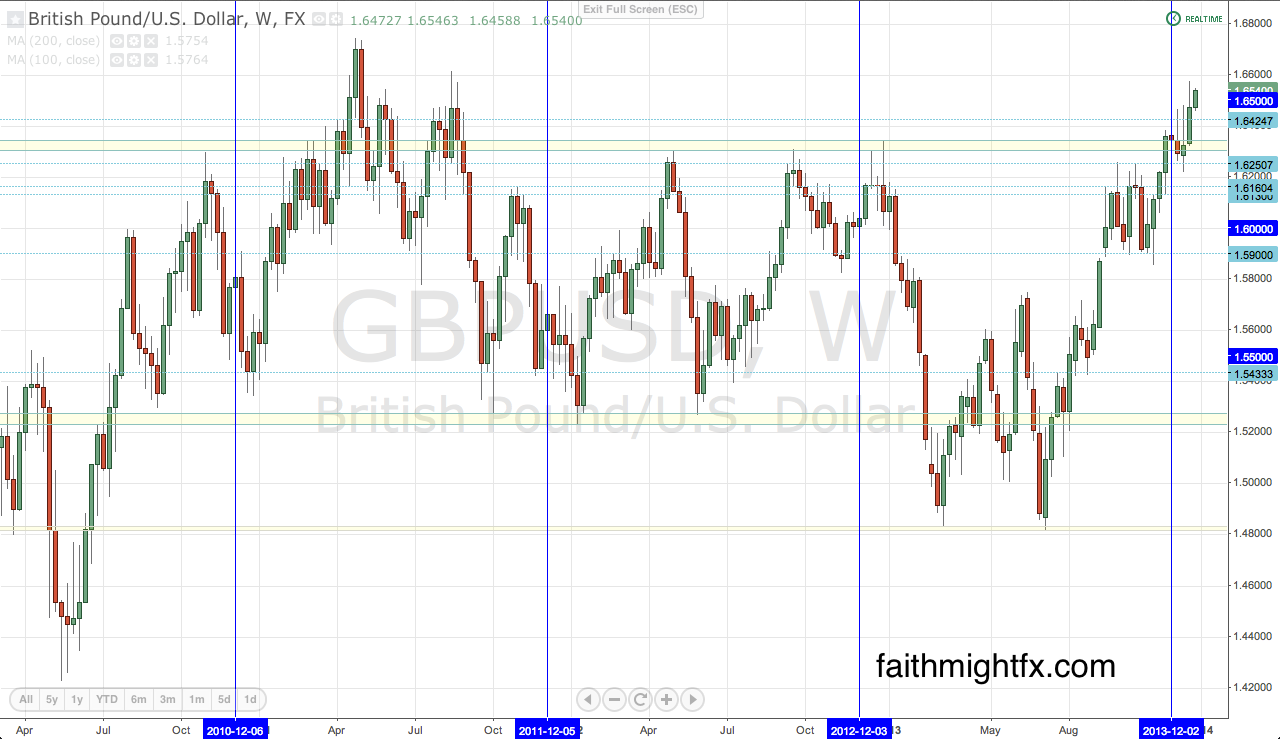
PREDICTION: $GBPUSD will fall to 1.5750 for the 1st half of the year and have a decision to make – either return to 1.65 or move lower to 1.50. This decision will largely be a function of the UK economy and Bank of England monetary policy. If the economic recovery continues into 2014, the BoE will not just consider a taper of its own but will actually move straight to the raising of interest rates. This will be extremely bullish for sterling as its central bank would be the 1st QE wielding central bank to raise interest rates since 2007. However, if the economy starts to waver GBP will come quickly undone as the driver of its 2013 rally starts to deteriorate.

As the Reserve Bank of Australia continues to intervene in the forex market, GBP continues to be a major beneficiary. Since the admission of RBA intervention, $GBPAUD has remained very strong. In fact, it seems to me that the RBA is actually weakening the AUD by buying GBP instead of USD to effectively lower the $AUDUSD exchange rate. It is very interesting that the RBA would choose to hold GBP rather than USD and perhaps a large reason why the USD has been unable to really rally since the December taper.

GBPAUD WEEKLY CHART

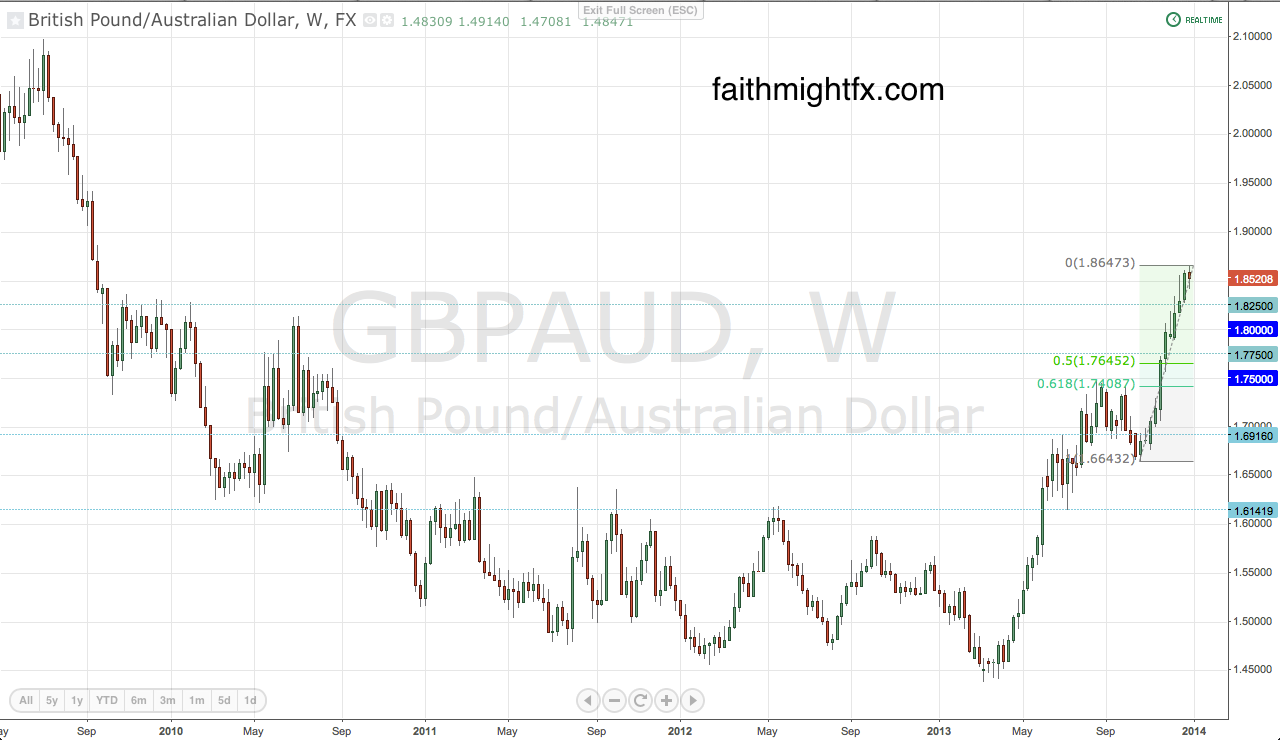
PREDICTION: $GBPAUD will move to 2.00 on continued RBA intervention.

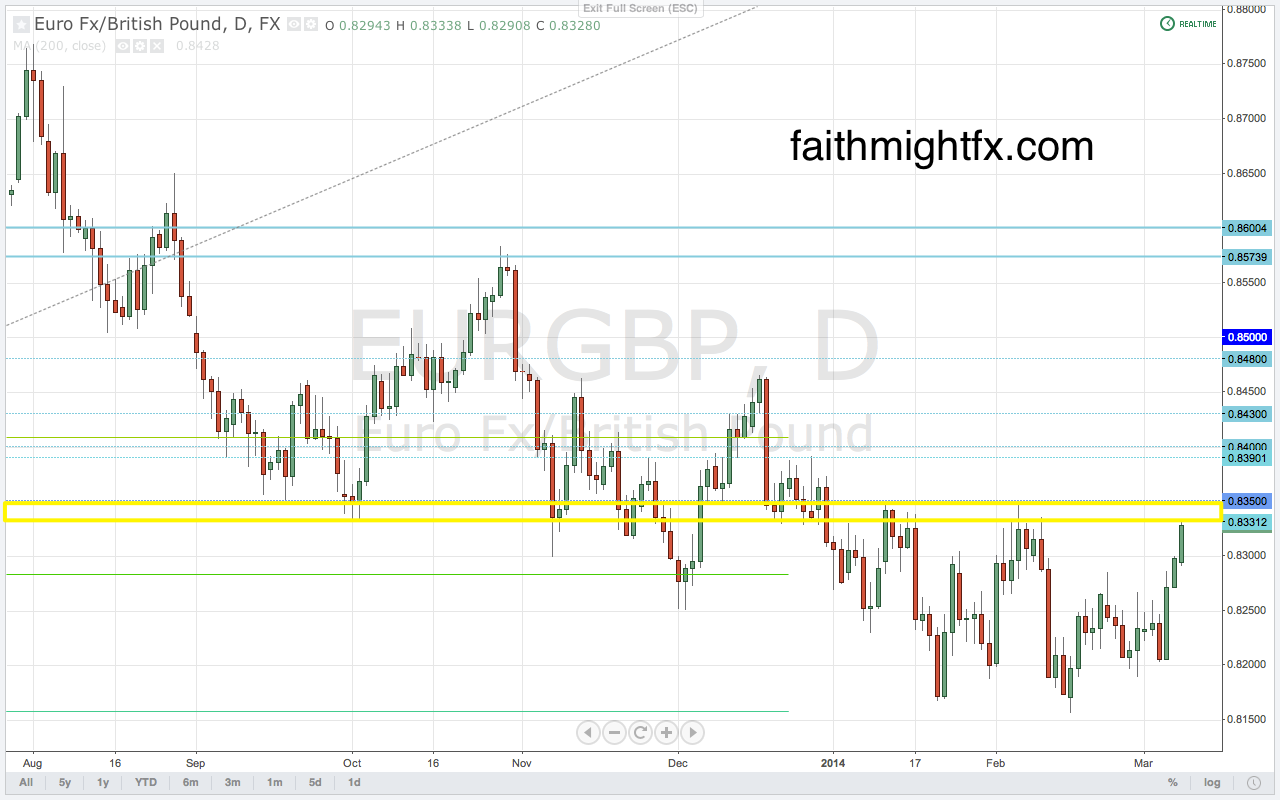
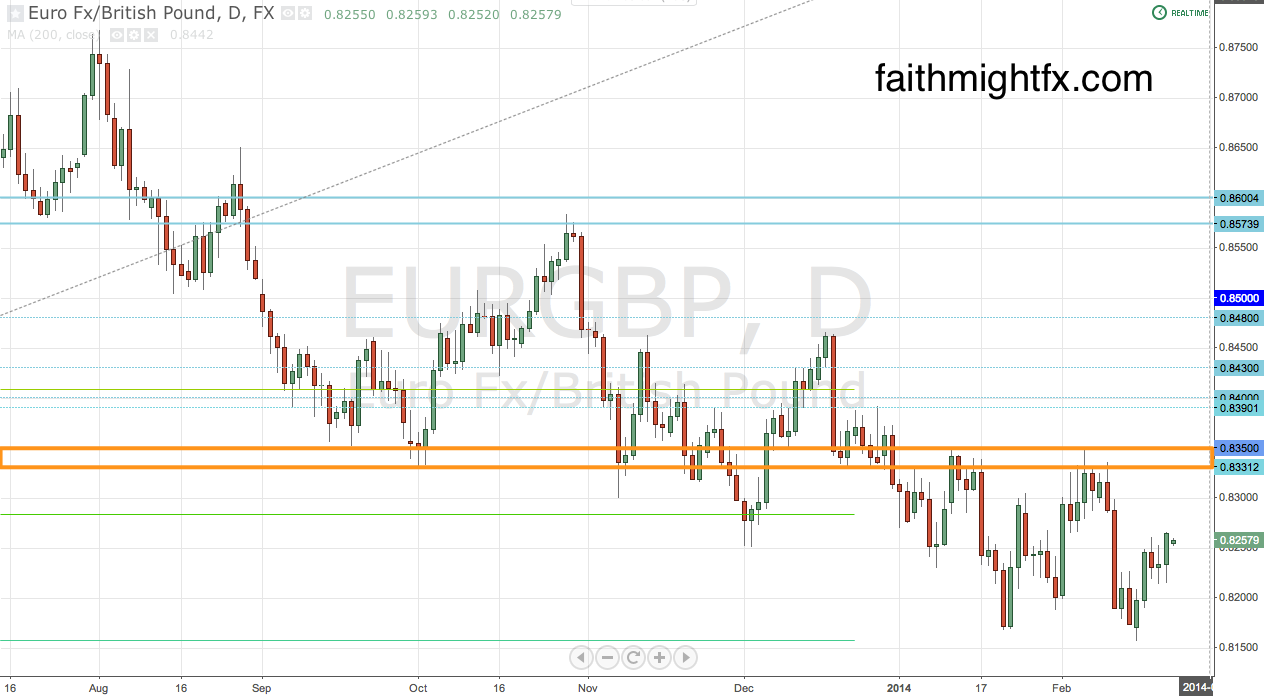
While Germany remains robust, all other European countries are still struggling to find economic footing. So despite the global economy picking up steam, the European Central Bank will continue to be very accommodative to support the European economies in 2014. As the $GBPUSD enjoys a steep correction, those flows will rally the $EURGBP back to 0.8600. However a late year rate cut by the ECB along with USD strength will knock the luster off the EUR. Unable to make new highs, the surge in GBP will see $EURGBP to new lows at 0.8000.

EURGBP weekly chart

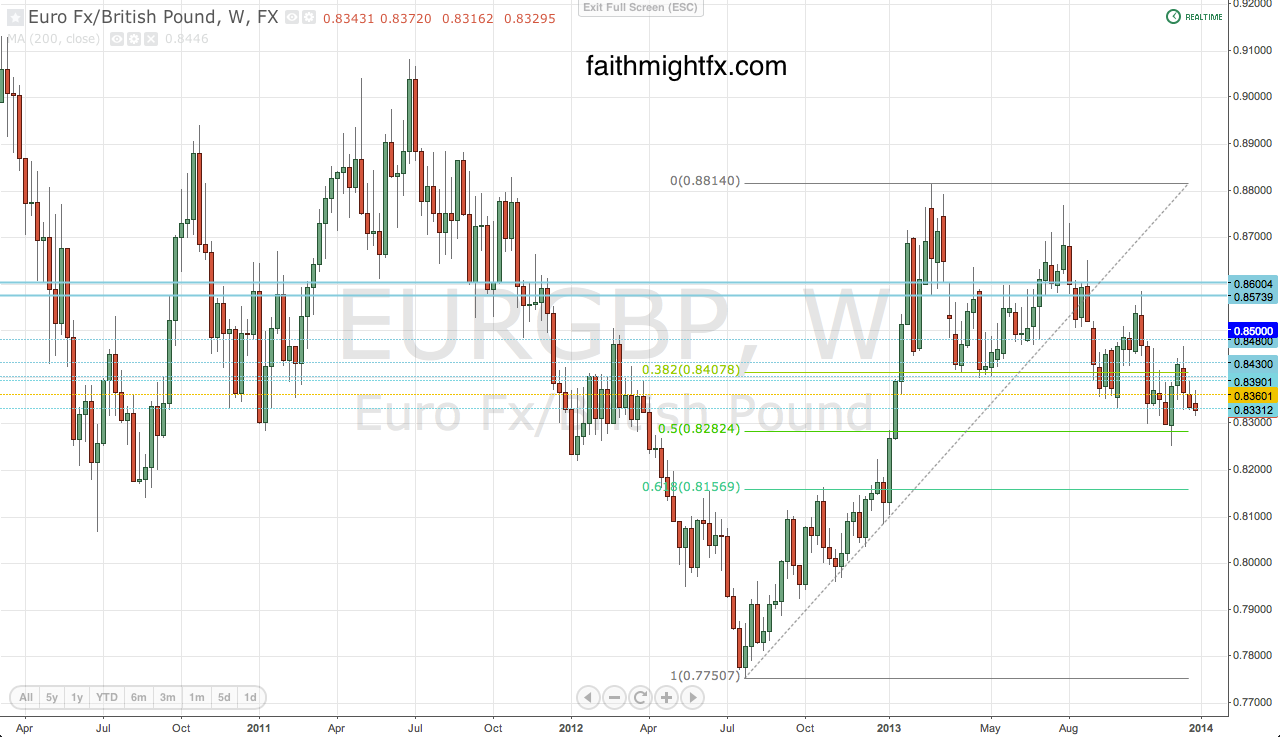
PREDICTION: The $EURGBP will fall below 0.8000 on a BoE rate hike and ECB rate cut combo.

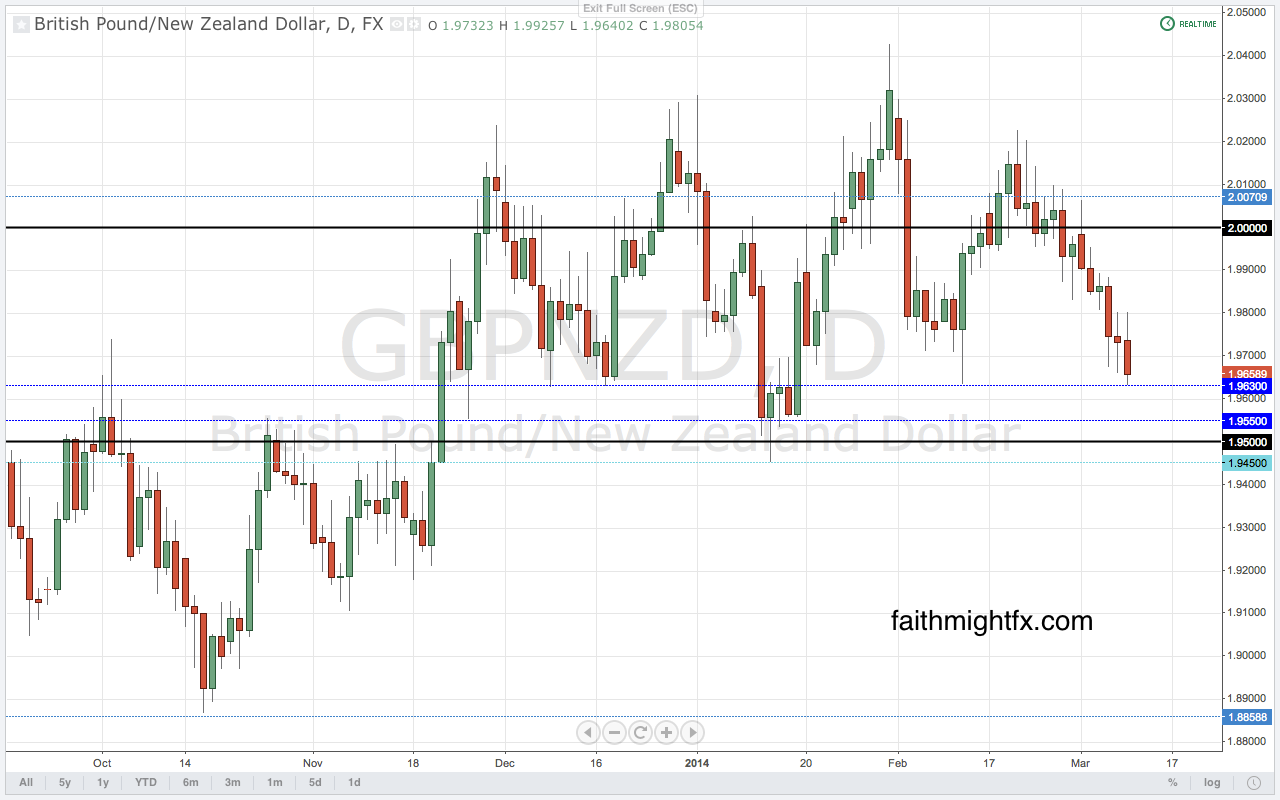
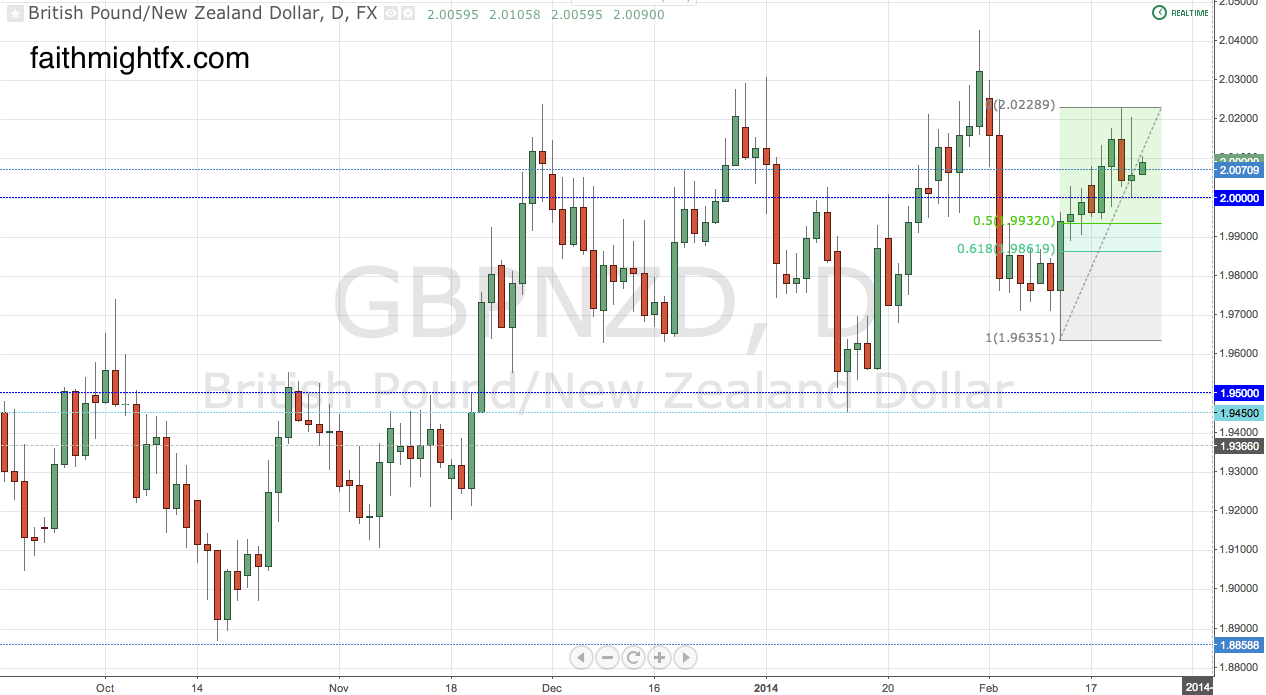
While New Zealand enjoys economic growth and relatively high interest rates, the NZD has weakened substantially versus the GBP in 2013. The big reason for this is the Reserve Bank of New Zealand using monetary policy to cool the New Zealand housing sector and the $NZDUSD exchange rate. Back in October, the RBNZ admitted to intervening in the forex markets and that admission marked a bottom in the $GBPNZD. The currency pair went on to rally over 1400 pips. Additionally, as the USD strengthens, commodities stand to weaken which could also further rally the $GBPNZD.

 GBPNZD weekly chart

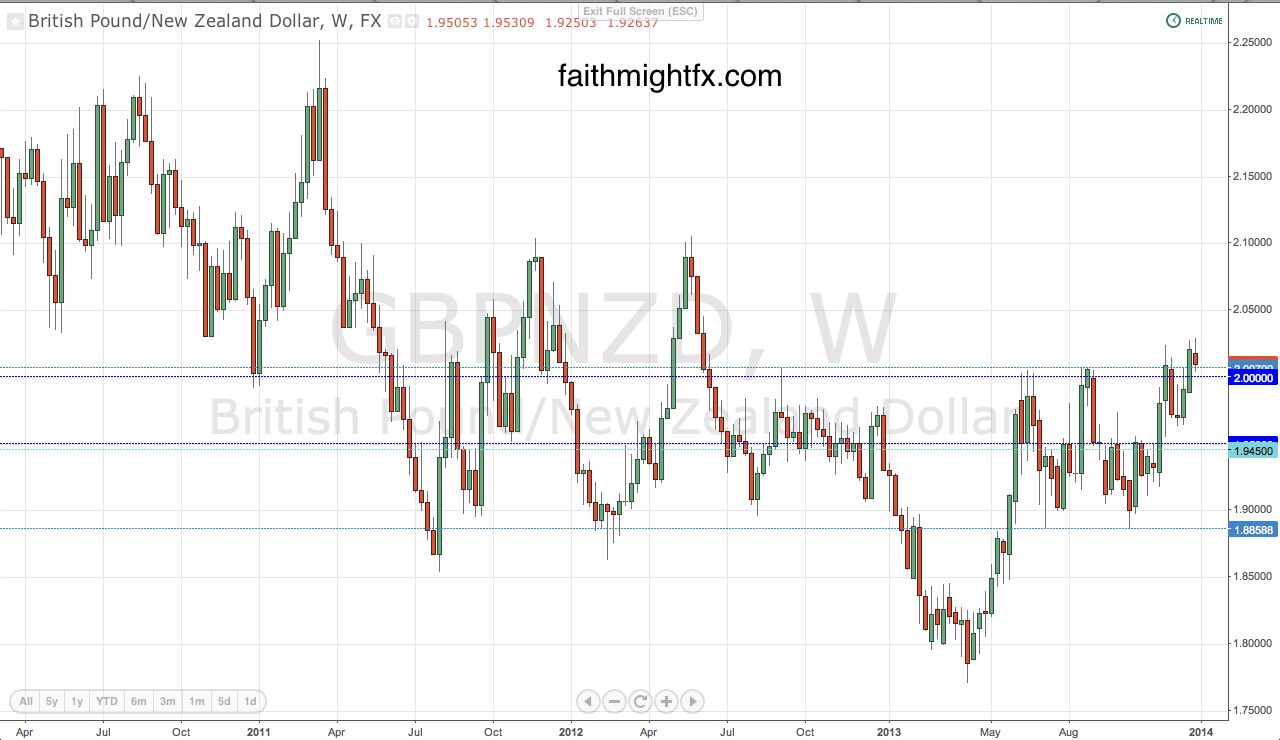
PREDICTION: The $GBPNZD will continue its rally and revisit the highs at 2.1000.

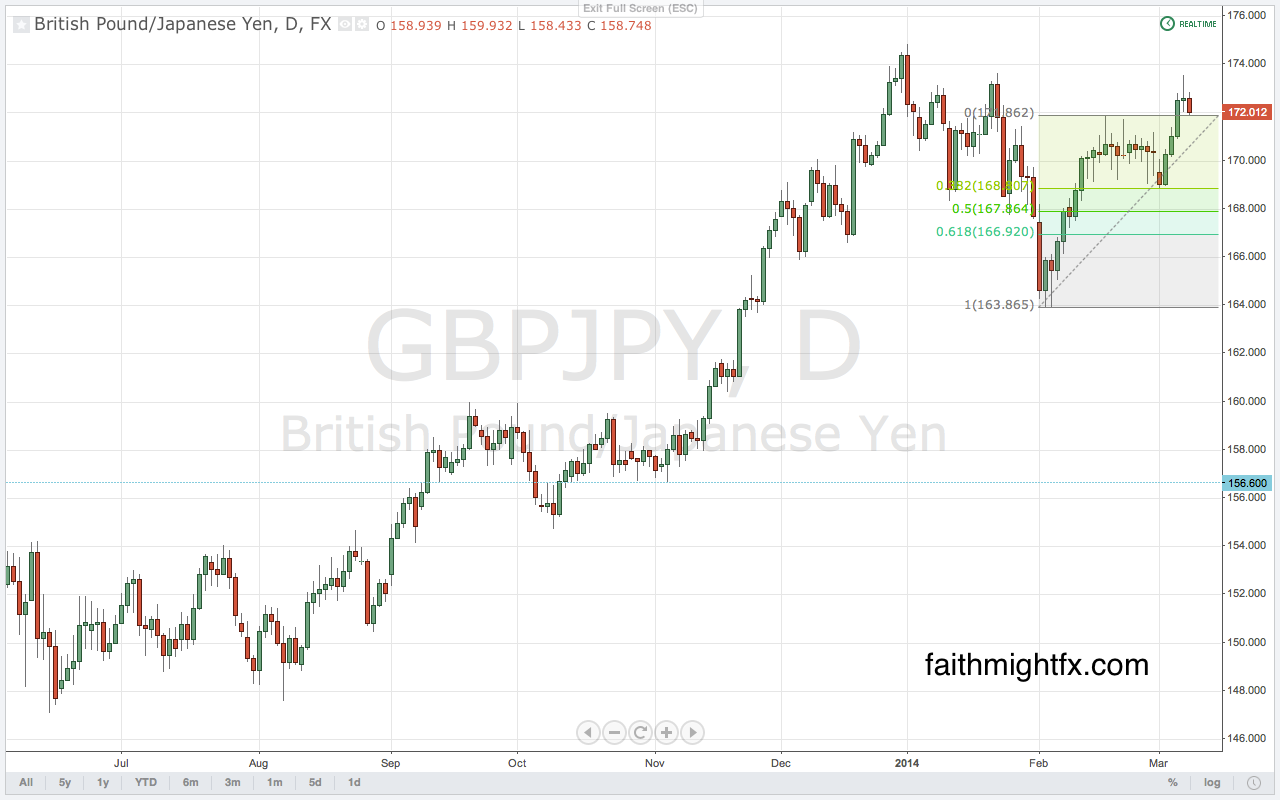
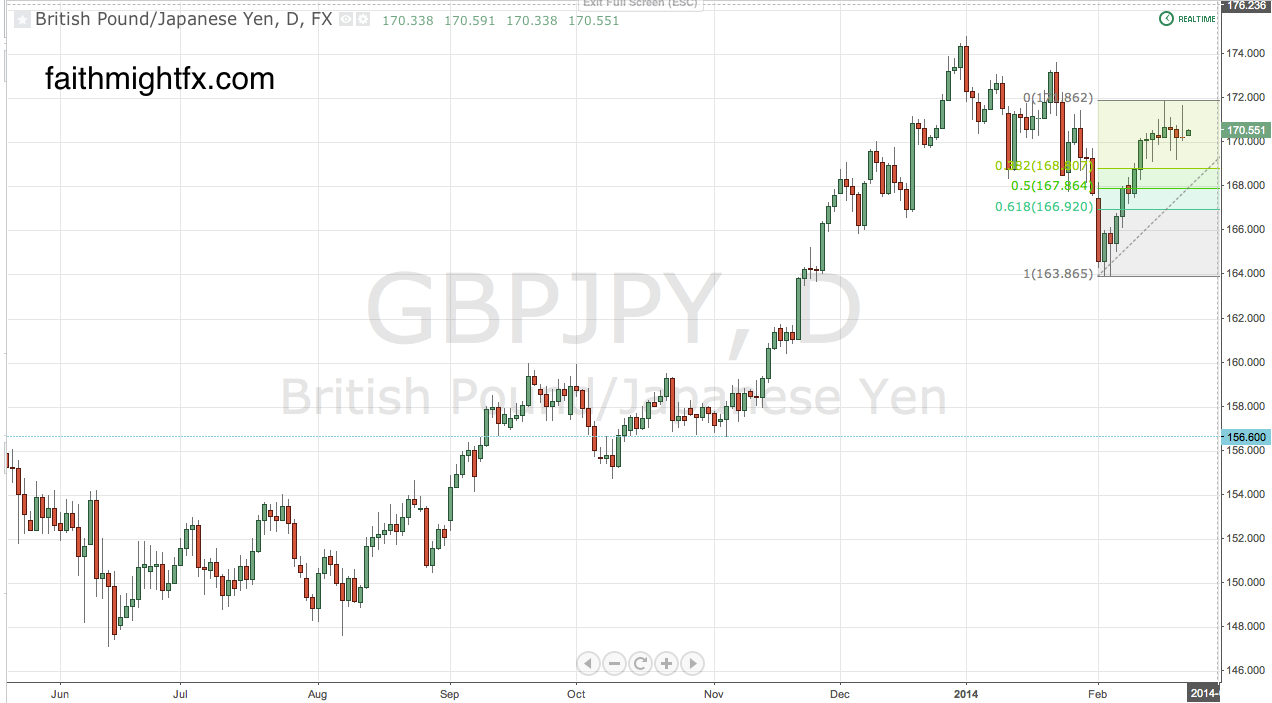
Since the dawn of Abenomics, the JPY has weakened as a matter of national policy. As such, the $GBPJPY has enjoyed a tremendous rally that was only fueled by the good turn in British fundamentals. The $GBPJPY rally of 2013 has begun to correct the 14,000 pip decline perpetuated by the financial crisis of 2008. Japanese officials are getting exactly what they want in a weak JPY and only have plans to keep that gravy train going.

GBPJPY monthly chart

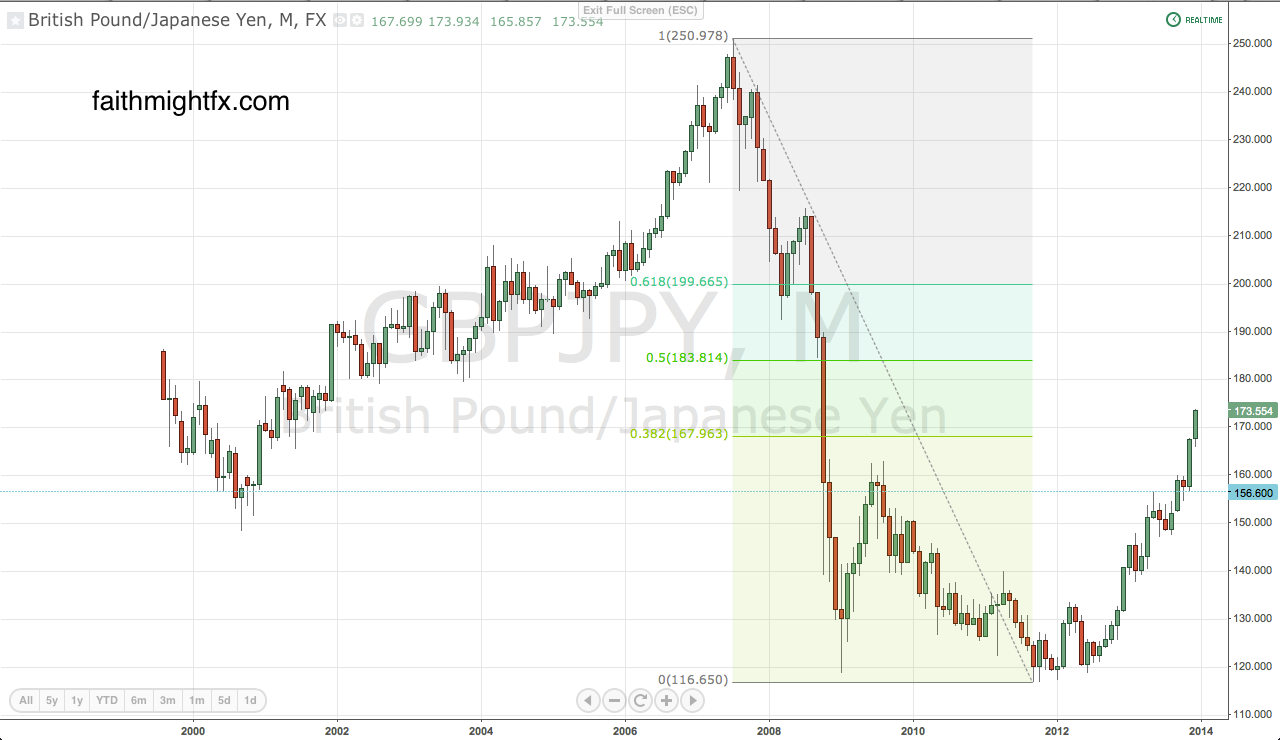
PREDICATION: The $GBJPY continues its rally to 200.00.

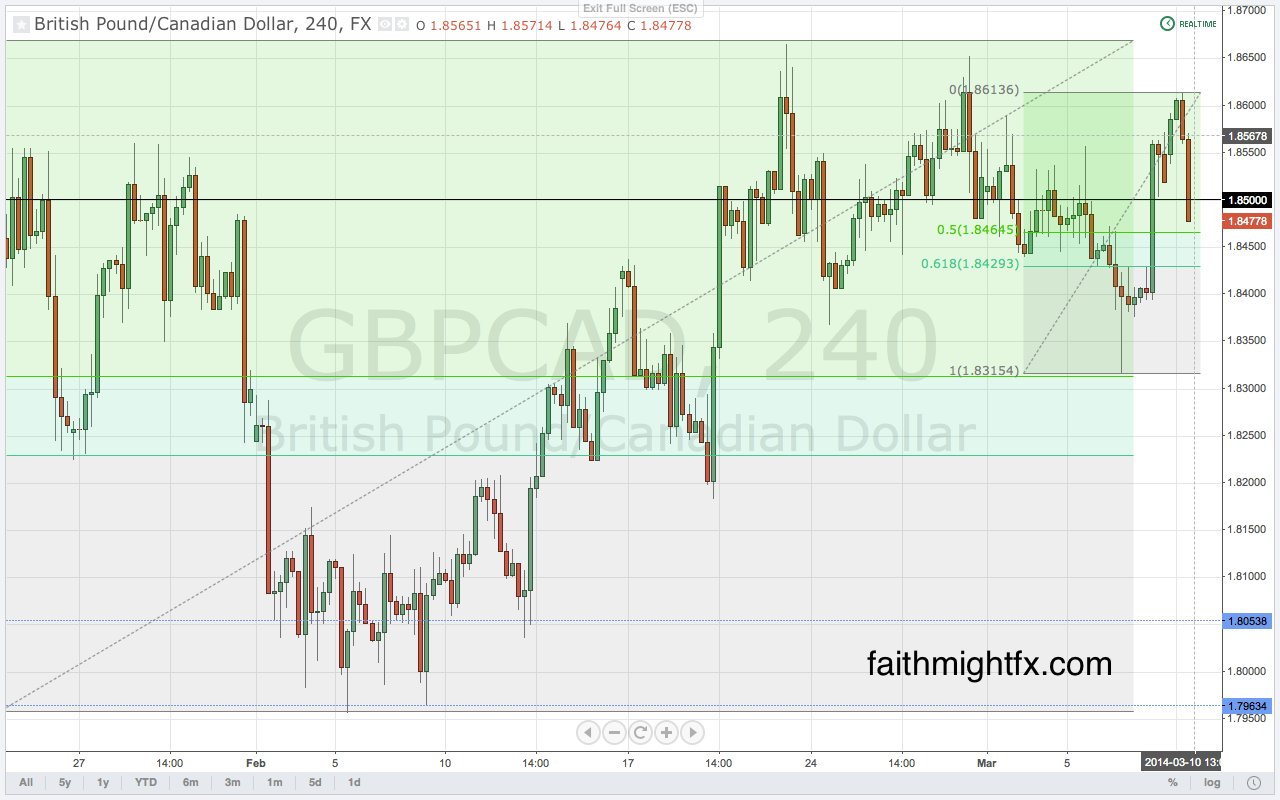
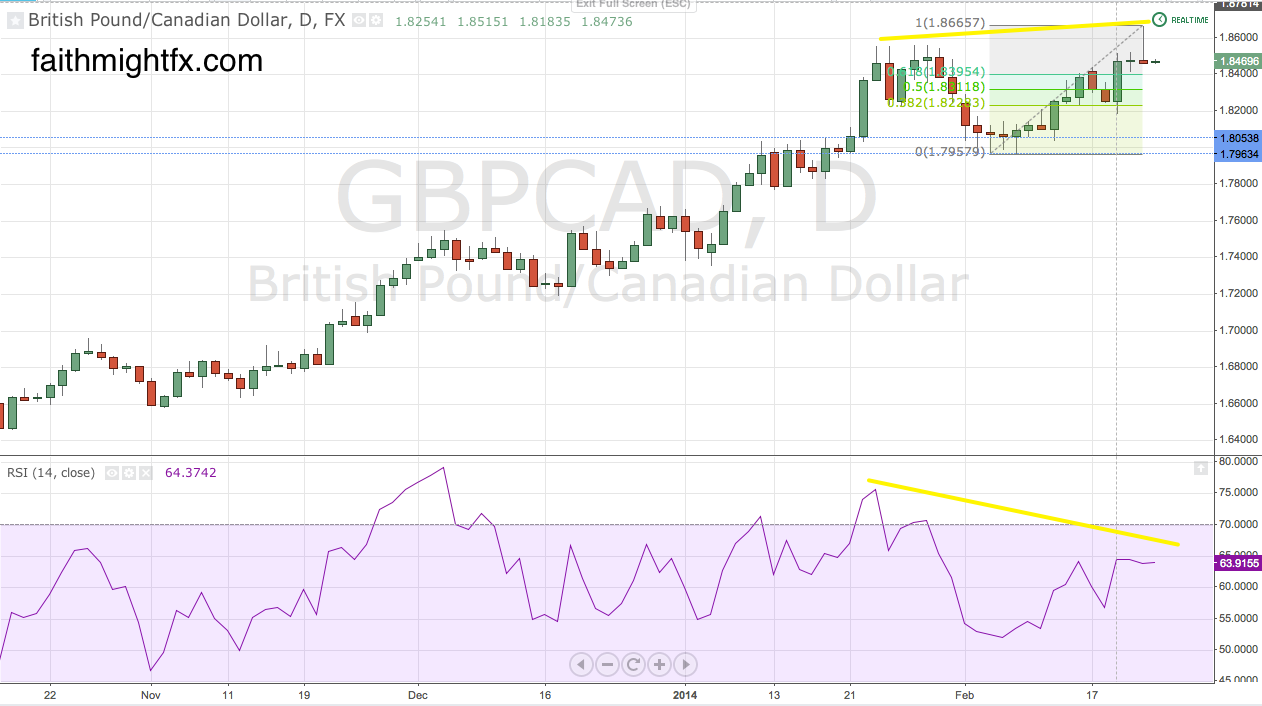
The Bank of Canada began 2013 as one of the more hawkish central banks. However, in the 2nd half the year, the BoC turned more dovish citing concerns about economic growth and inflation. As a result, the $GBPCAD surged to levels not seen since 2010. With the $GBPCAD now above 1.7500, the technical picture points to more strength.

GBPCAD monthly chart

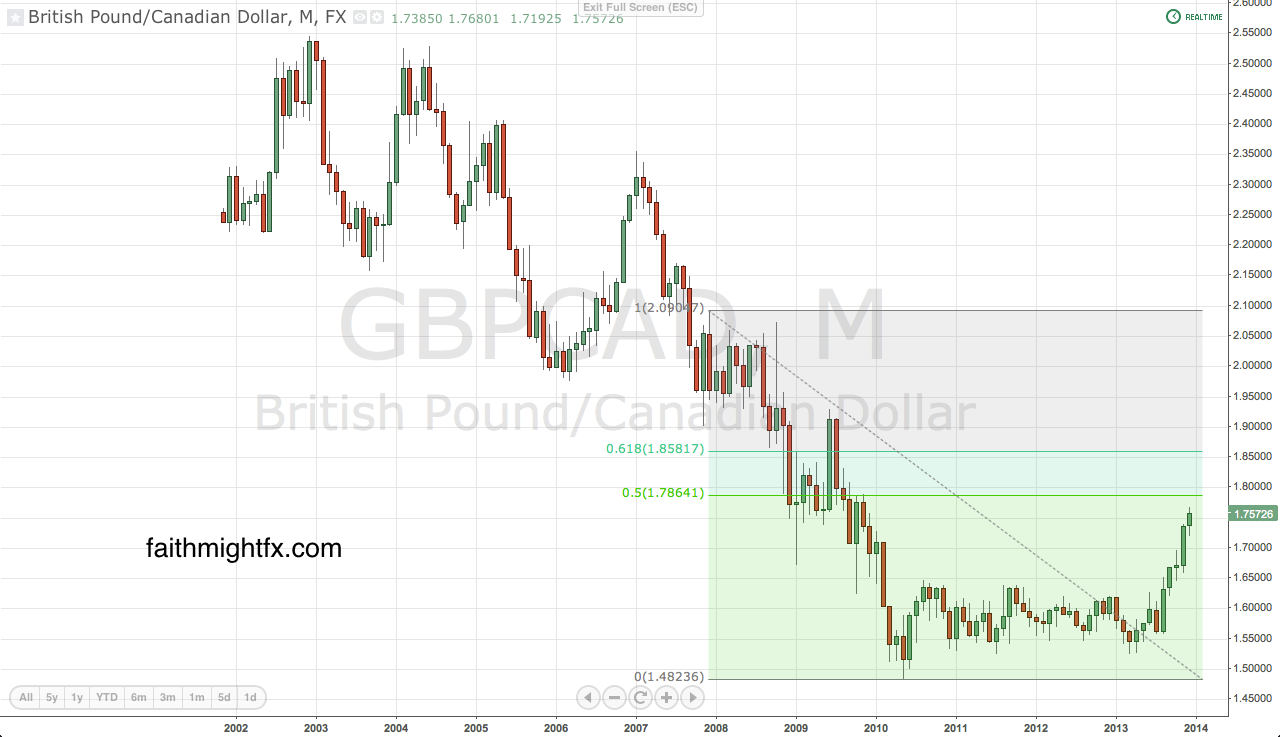
PREDICTION: The $GBPCAD continues higher to 1.8500 – 1.9000.

The Swiss National Bank put a cap on the $EURCHF back in 2012 and defended that exchange rate with unlimited currency interventions in the market. As such, the $GBPCHF has been rangebound between 1.4000 to the downside and 1.5000 to the upside for all of 2013.

GBPCHF weekly chart

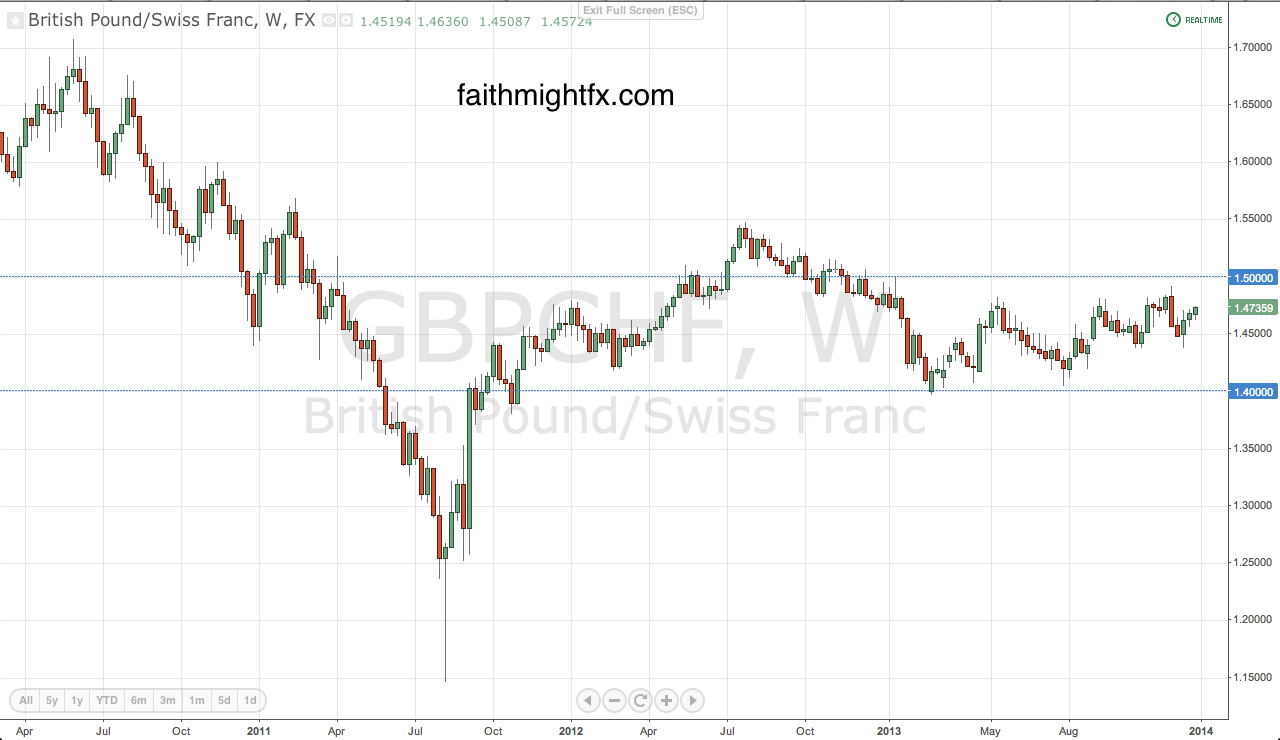
PREDICTION: $GBPCHF remains rangebound between 1.4000 and 1.5000.


2013 has been a fantastic year for me both personally and professionally. My girls started new schools. My boy came into his own this year. I spoke on my 1st panel. I made multiple appearances on FXStreet’s Live Analysis Room (watch my latest). I appeared on BTFD.tv for the 1st time. (Catch our new year show this Friday, January 3 at 6:00am EST at BTFD.tv! It’ll be fun!) I launched, then shuttered, a forex service. I invested more and traded better. I had failure and success and learned tremendously from it all.

Happy New Year!

Sterling Digest, 27 December 2013: the Last Friday

the FED. Free money. Take some. | Gary Varvel cartoon
The reason why GBP continues to rally in some pairs and may correct in others for 2014

It has been an incredible 2013 for GBP sterling. It is only fitting that we see these breakouts only extend further on this last Friday session of 2013. The $GBPUSD, $GBPNZD, $GBPCAD, $GBPAUD, and $GBPJPY all hit multi-year highs today. Amongst these, $GBPUSD is the only seeing a correction off the highs. Others, like the $EURGBP and $GBPCHF,  actually saw sterling decline today though both recovered losses as trading wore on. In thin holiday markets, this last Friday saw volatile price action in contrast to very rangebound markets during the early half of this week. Given the year that was 2013 in sterling, what does 2014 hold in store for GBP trading? Instead of the uniform moves that we got for much of the 2nd half of 2013, it looks like sterling will be a mixed bag in 2014.

Image credit