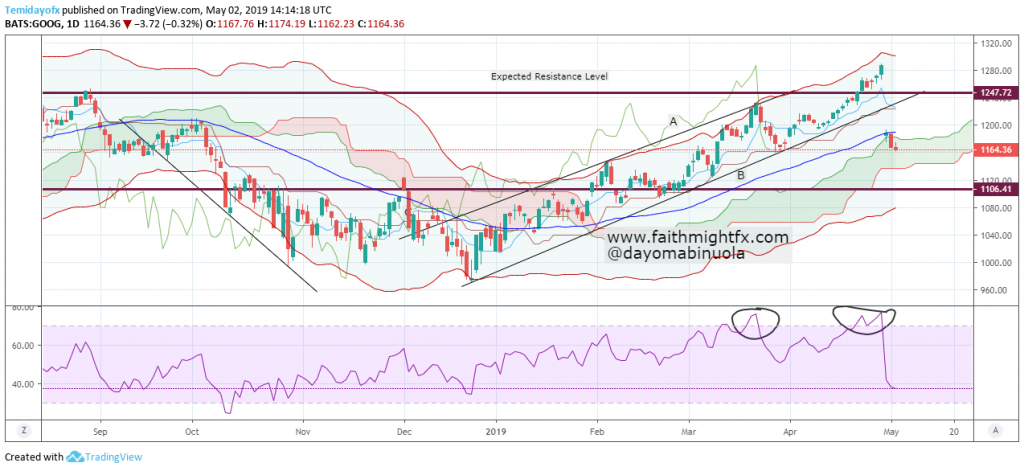
Our last analysis on Google shows the share price was going to rise. . Price was able to go beyond the expected resistance level of 1123.23. The bullish movement from last year was able to reach 1288.30 on the 29th of April 2019. At the last trading day of April, a gap down occurred which confirmed the beginning of a downtrend. RSI at two different occasions between March and April had shown overbought positions.

Ichimoku is yet to show a reversal, but shows the $GOOG bulls are still in charge. The gap down which occurred made price of $GOOG on the Bollinger band to cross to the lower region of the chart which is presently in the Ichimoku cloud. The share price of $GOOG is currently at 1168.89. Now that price has crossed to the lower region of the Bollinger bands, this could make price to continue to fall more to 1106.41. $GOOG lost about 100points after the gap down. As we await price to continue the downward trend, it might still lose 150points more.
