fbpx

S&P 500 Bounces From 2022 Support Level

S7P 500 bounces from Support Level

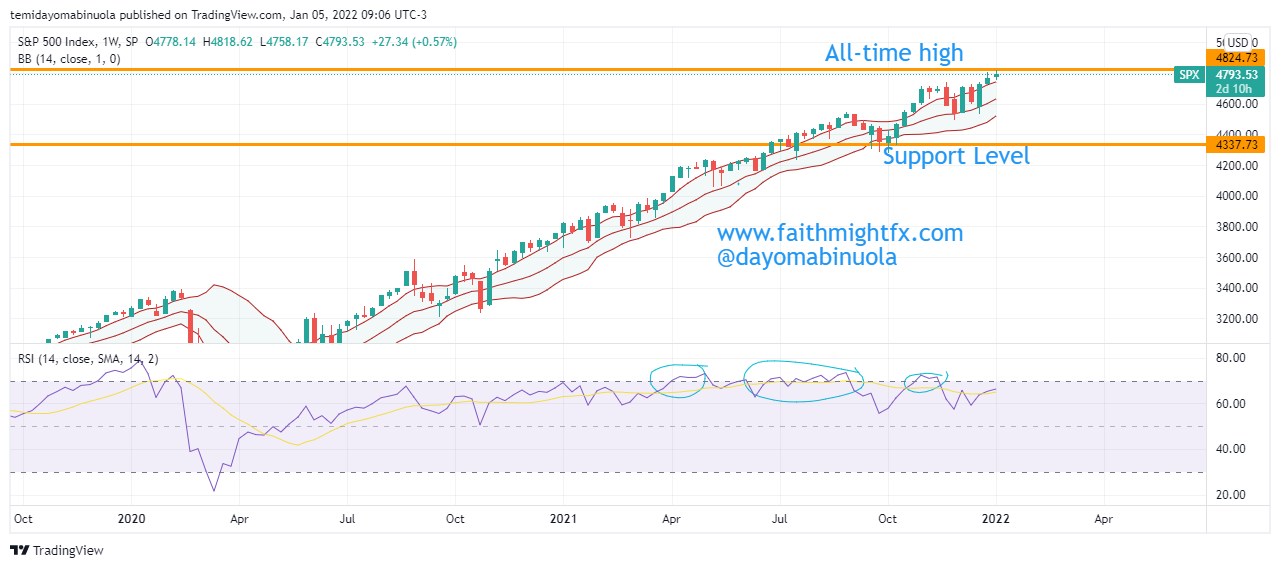
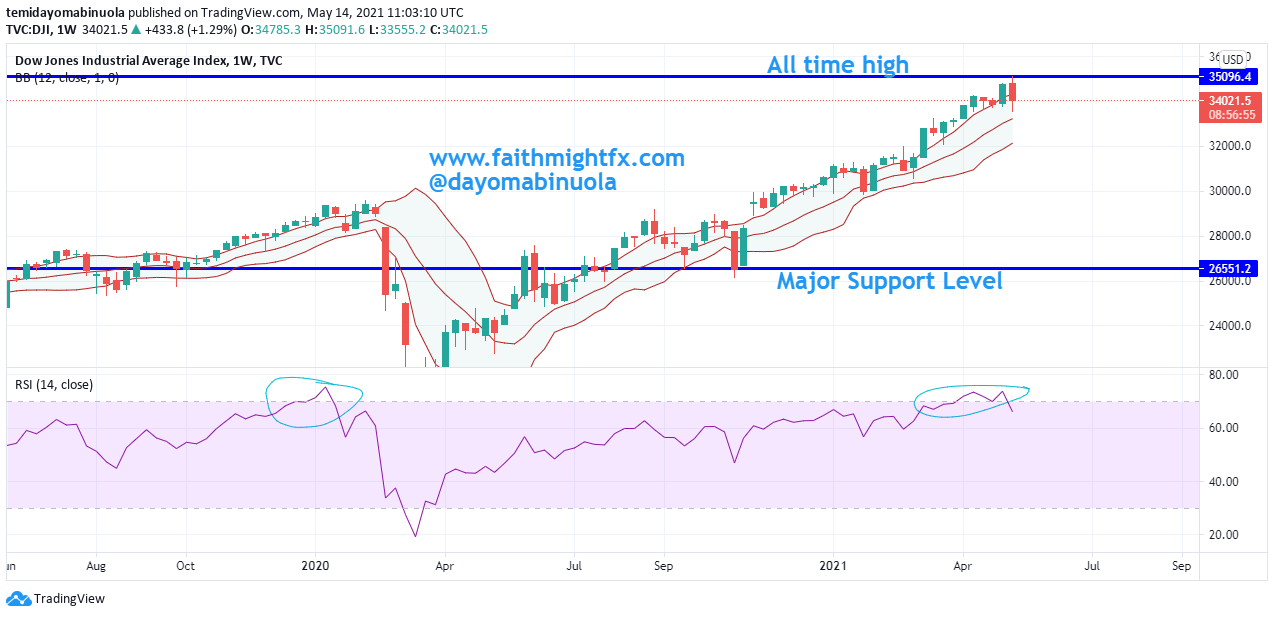
For about two years, between March 2020 and January 2022, SPX was in a bullish marathon. The support level as of March 2020 was $2210. The rally peaked at $4822 in January 2022. This price stands as the all-time high for the stock index.

Despite price reaching the all-time high in 2022, last year was a bad year for SPX investors as price went as low as $3488 in October 2022 as a result of the bearish turn. That low was 2022’s support level. 2023 has shown a bit of hope as there has been a bounce from 2022’s close of $3833. SPX opened in 2023 at $3845 and is currently at $3969.

Daily Chart

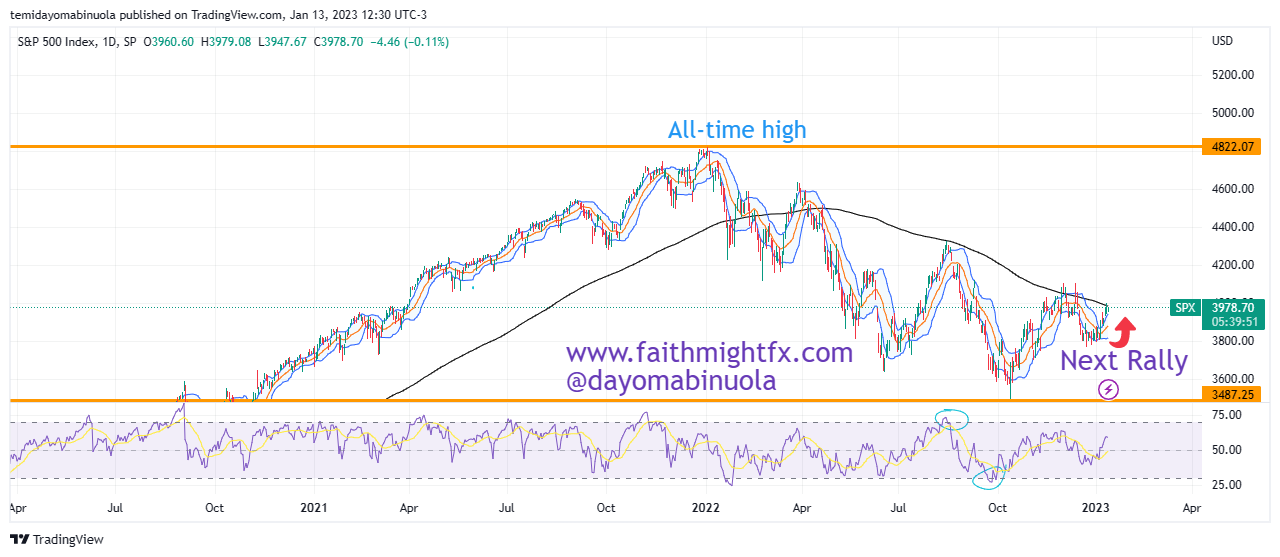
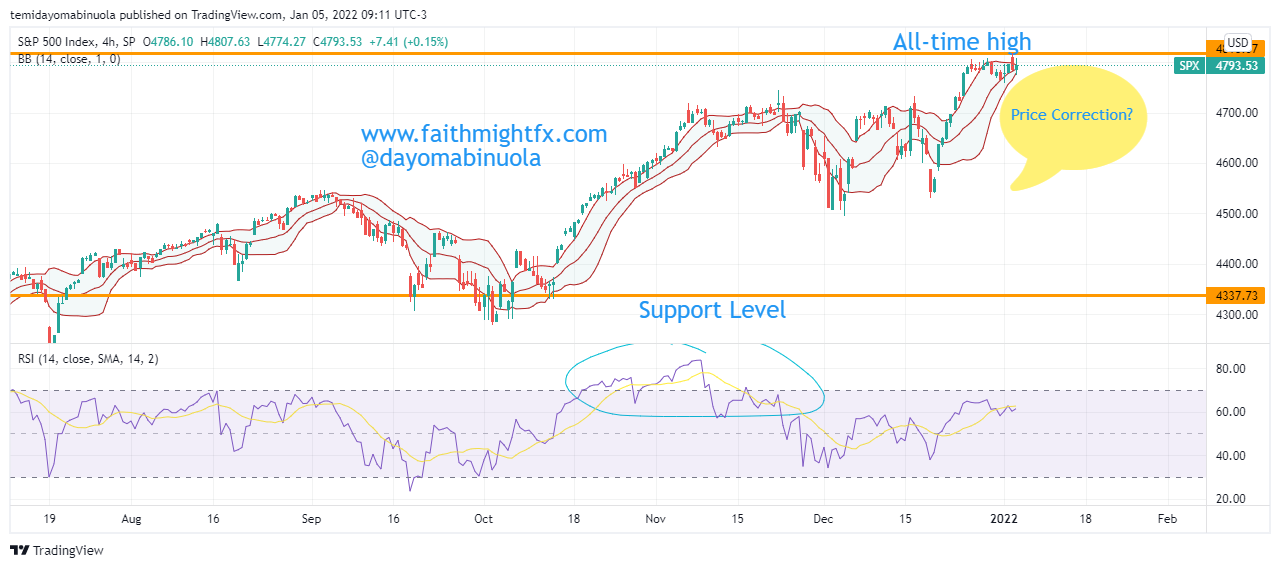
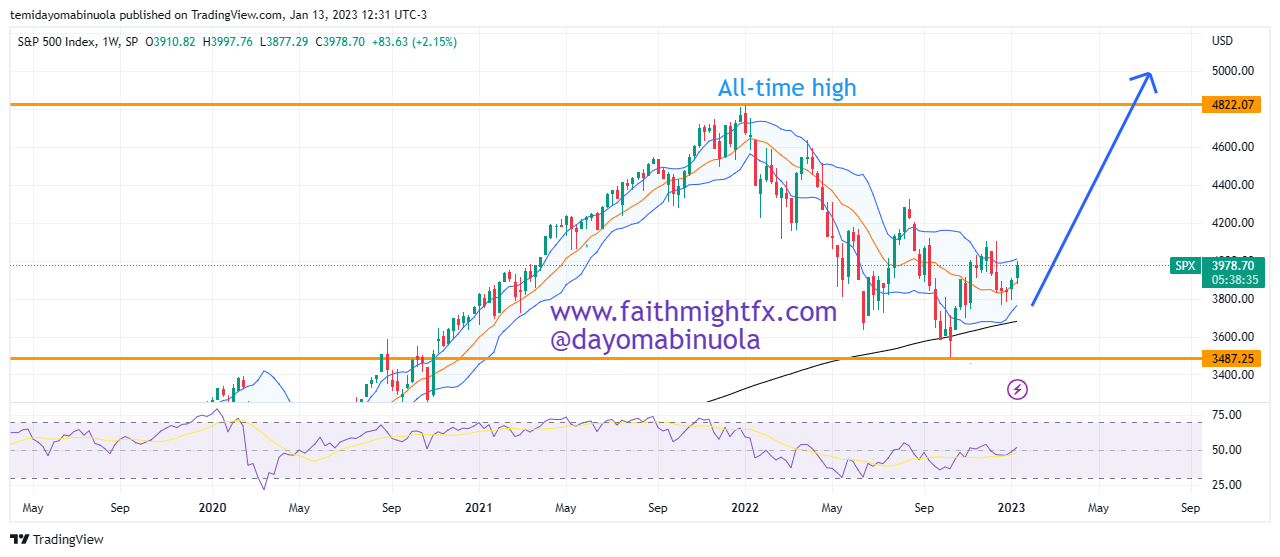
On the daily chart, RSI indicates that price was oversold as of October 2022. This might be the reason for the recent rally. This oversold position may be able to create a bullish force that in the long run can push SPX above the all-time high thereby creating a new all-time high. However, in the short term, we might be seeing price rally above $4200 in the coming weeks.

Weekly Chart

Some of these ideas are in our clients’ portfolios. To understand if this one can work for you or for help to invest your own wealth, talk to our advisors at FM Capital Group. Would you like more information on how to get stock index in your portfolio? Schedule a meeting with us here

S&P 500 And Dow Jones Reach A New All-Time High

 In our November article on S&P 500, the price had a correction as our analysts forecasted that $SPX could reach a new all-time high at $4800. The $4800 forecasted price was surpassed as the most recent all-time high is at $4824.53.  Many stocks in the SPX appreciated around this time. SPX has been able to make 1X since the pandemic lowest price at $2210. The current price of SPX is $4793.53 after the price closed yesterday lower than the all-time high at $4824.53. 

SPX Weekly Chart


The new variant of the coronavirus named ‘IHU’ detected in France might likely pose a threat to the index, which might lead to a price fall.  A sell-off might occur which could make the price of SPX fall to $4384.23. Despite the new all-time highs in the past months, SPX on the RSI has shown that price has been overbought multiple times since April 2021. 

SPX 4hr Chart


Dow Jones on the other hand made almost 1X the pandemic low at $18366. The Dow Jones recorded a new all-time high yesterday, being the second trading day of the year. There is no indication of a possible reversal. Early in December, our analysts forecasted the Dow Jones to reach a new all-time high. The new all-time was reached yesterday at $37,000.  A correction might take place.

Dow Jones Daily Chart

As SPX had a price fall on the second trading day of the year, Dow Jones extended its rally to a new all-time high at $37,000. The only threat to the continuous rally of the $DJI could be the new variant ”IHU’, which health officials found it has 46 mutations. These mutations are more than the omicron.  The price still maintains the upper region of the Bollinger bands. The $DJI might continue its rally for the next few days or weeks.

Dow Jones Weekly Chart

Some of these ideas are in our clients’ portfolios. To understand which ones can work for you or for help to invest for your own wealth, talk to our advisors at FM Capital Group. Would you like more information on Investment Advisory, Portfolio Services, and VC? Schedule a meeting with us here.

Dow Jones Might Plunge Further

After a major dip to $18,900 occurred in the price of Dow Jones in March 2020. Price retraced to the resistance level at $29,500 in the same month. $DJI broke the resistance level at $29,500 in November 2020. Since this breakout occurred, $DJI has consistently reached a new all-time high every month. The recent all time high occurred this week at $35,100. $DJI’s price at the beginning of this year was at $30,200.  As at today, price of $DJI is at $34,000, which is about 11% gain in 2021.   

After the all-time high at $35,100 was reached this week, two bearish candlesticks were formed in the next days. These two candlesticks were as a result of the inflation data that was released on Wednesday. the $DJI plunged 680 points. Investors might have been fearful, hence the reason for the selling. Both S&P 500 and NASDAQ also took a nosedive. Could this be sign of the beginning of a bearish trend?

When a major dip occurred in March 2020, RSI showed price has been overbought. RSI is currently showing that p rice has been overbought. This could lead to a major dip in price. If this dip occurs, it might make price reach the support level at $26,550. If In the next few weeks, price might just be consolidating around $34,000. If the inflation situation worsens, price might plunge further.