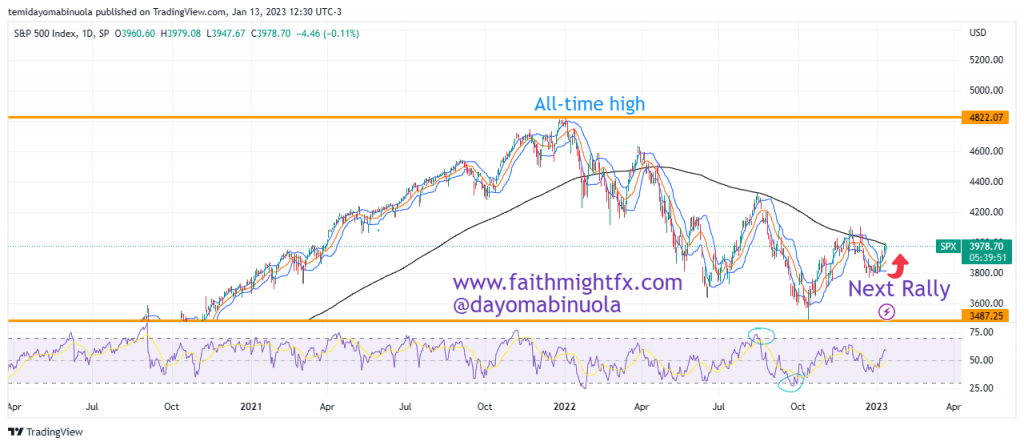
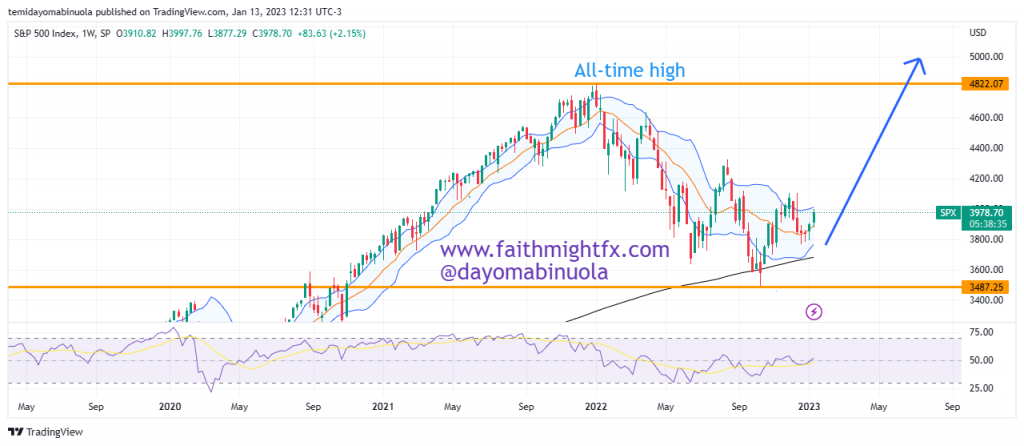
For about two years, between March 2020 and January 2022, SPX was in a bullish marathon. The support level as of March 2020 was $2210. The rally peaked at $4822 in January 2022. This price stands as the all-time high for the stock index.
Despite price reaching the all-time high in 2022, last year was a bad year for SPX investors as price went as low as $3488 in October 2022 as a result of the bearish turn. That low was 2022’s support level. 2023 has shown a bit of hope as there has been a bounce from 2022’s close of $3833. SPX opened in 2023 at $3845 and is currently at $3969.

On the daily chart, RSI indicates that price was oversold as of October 2022. This might be the reason for the recent rally. This oversold position may be able to create a bullish force that in the long run can push SPX above the all-time high thereby creating a new all-time high. However, in the short term, we might be seeing price rally above $4200 in the coming weeks.

Some of these ideas are in our clients’ portfolios. To understand if this one can work for you or for help to invest your own wealth, talk to our advisors at FM Capital Group. Would you like more information on how to get stock index in your portfolio? Schedule a meeting with us here

