fbpx

Microsoft Sees Worst Close Since May 2021

Microsoft investors have enjoyed bull runs for 13 years as the lowest price within that time frame was at $15.10. Despite the worldwide lockdowns and the negative impact on many stocks across the world, Microsoft’s share price didn’t see a major reversal. What the Microsoft share price saw, at worst, were corrections. 
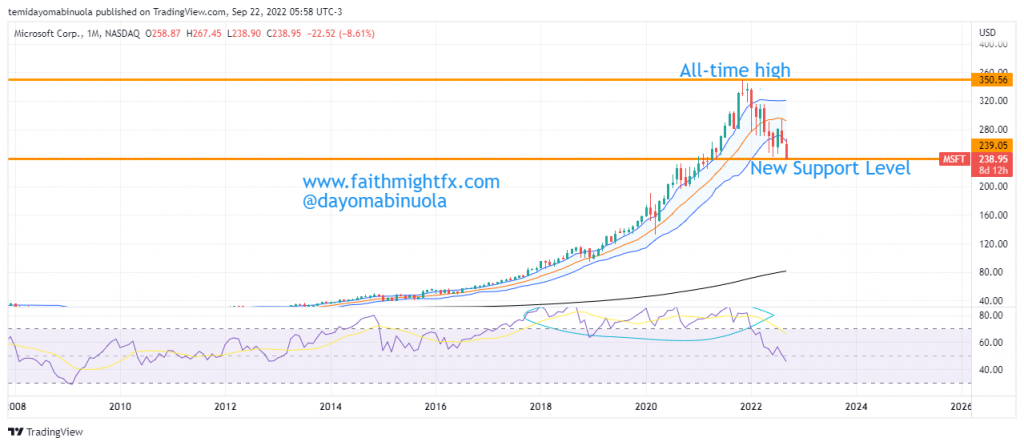
Monthly Chart

In fact, during the lockdown, Microsoft saw a correction between February and March after which it began to rise. This rally continued up until November 2021 as price reached $350, which stands as the all-time high. After this all-time high was reached, the activities of the bears can be likened to those in 2008 as price is currently at $238. Also, since 2015 using the monthly time frame, this is the first time four candlesticks will be seen in the lower region of the Bollinger Bands.
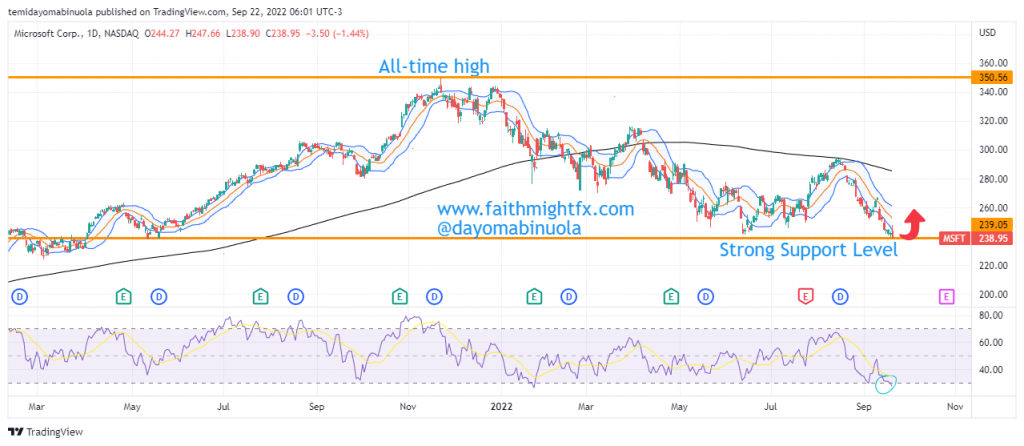
4hr Chart

We might be seeing a rally to $250 per share in the next few weeks. The 4H timeframe at two different times in September shows that price has been oversold. This could be an indication for the next appreciation in price.

Some of these ideas are in our clients’ portfolios. To understand if this one can work for you or for help to invest your own wealth, talk to our advisors at FM Capital Group. Would you like more information on how to get stocks in your portfolio? Schedule a meeting with us here
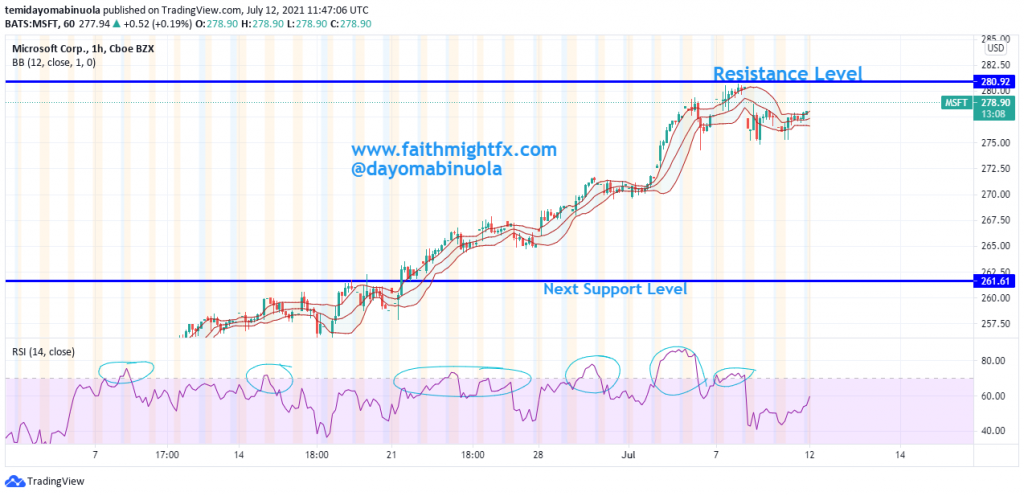
MICROSOFT CURRENTLY RANGING AROUND THE ALL-TIME HIGH

In the early trading days in 2018, Microsoft’s share price broke out comfortably above $100. And since then, the price is yet to reverse toward $100. The bull run continued until February 2020 when the price reached $190.82. As at that time, a resistance level was formed around $190.82, which lasted for about 3 months, as the support level was $134.07 in March 2018. This correction was the longest one since 2018, which was about 29.7%. The next rally after the correction has made a price of $MSFT attain $281.11 price.

Over the years, $MSFT has been investing hugely in products with Augmented reality and Virtual reality. These investments could be the major reason for the bullish run in the past few years. The most recent all-time high was reached at $281.11, on the 7th of July. The chart has the majority of higher low and higher highs patterns. Since the beginning of June 2020, RSI has shown many levels where price has been overbought.

A reversal could occur as a gap down and a gap up was shown on the chart when the price was below $250. A higher low might begin, which might push the price lower to reach $262.03. Also, many stocks are currently at the all-time high or ranging around the all-time high.