fbpx

Opendoor Is About To Open A Bullish Door For Investors

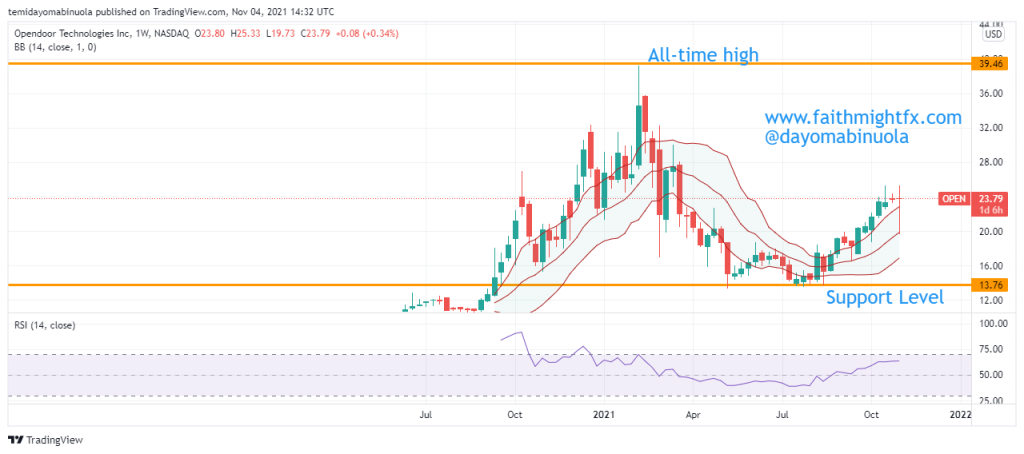
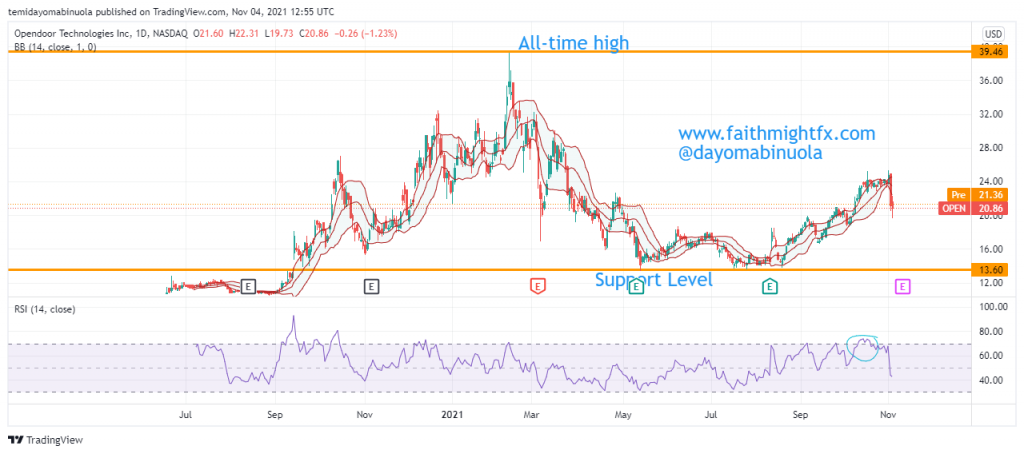
Opendoor Technologies Inc is an online company for transacting in residential real estate headquartered in San Francisco. Now, many real estate investments have done quite well since the lockdown. $OPEN’s IPO price in June 2020 was at $10. Since the IPO, the price has been able to reach $40, which is 4x, before this year’s price drop to the support level at $13.60. The all-time high price of Opendoor is currently at $39.77, which was reached in February 2021. Hope might be rising for investors as the second half of the year has brought about a significant rally in the price of $OPEN from the support level at $13.60 to the most recent high at $25.45.

The candlesticks have crossed to the higher region of the Bollinger Bands on the weekly, which signals that this could be a continuation of a rally. But in the last 3 trading weeks, the price is yet to breakout of the second half of the resistance level at $25.24. This week looks like a bearish one for $OPEN investors, as almost all gains in the month of October have been lost in the last 4 trading days.

A range in price has been occurring since May 2021, when the share price fell close to the IPO price at $10. The price range is between $13.48 and $18.56. Price of $OPEN closed on Wednesday at $20.86. If more bulls invest in $OPEN, the price might reach a new resistance at $30.56. The 4hr chart shows price has been able to breakout to the downside with this week’s correction. It could be a fake breakout.

Tesla Share Price Reaches An All-time High

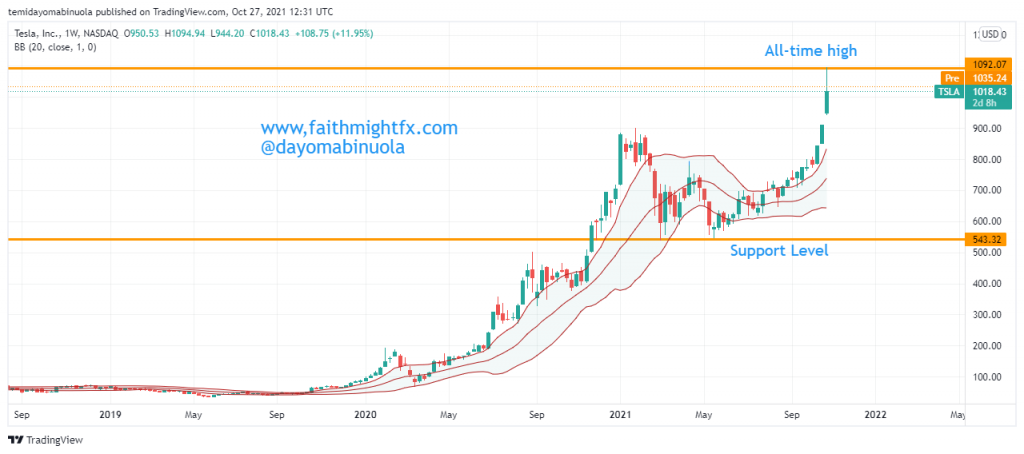
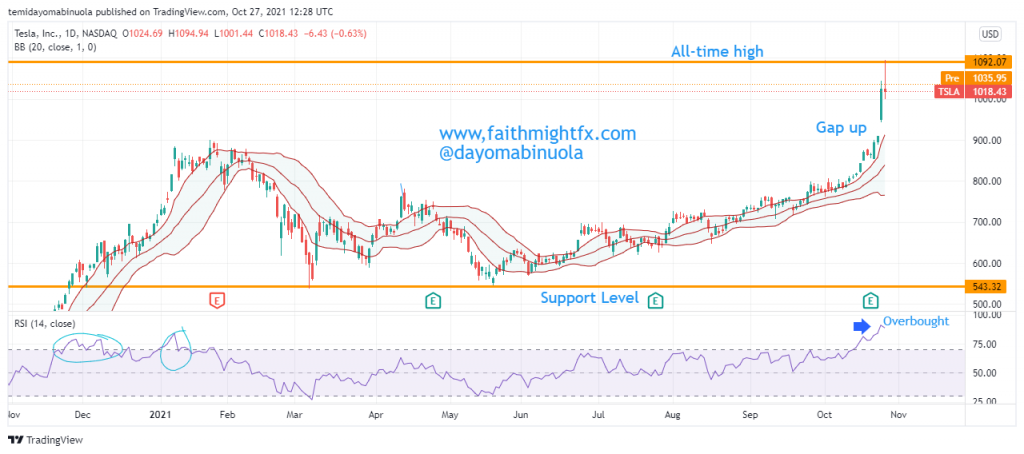
The American electric vehicle and clean energy company, Tesla surged to a $1 trillion valuation yesterday. The last two trading weeks have been bullish for $TSLA as the price broke the previous resistance level at $900 as the price closed at $910 on the week of the 22nd of October, 2021. The market opened this week, the 25th of October with a gap up at $946.71, then the price rallied $1092.07 which makes it an all-time after the last stock split that took place on August 31, 2020. The split was a 5 for 1, meaning for each share of TSLA owned pre-split, the shareholder now owned 5 shares.

Since March 2021, Tesla’s price has maintained a support level at $543.32 after the initial breakout to the upside in November 2020. Price retraced to touch the support level both in March and March 2021, before the most recent bullish movement to the all-time high.  On the weekly chart, there are a few gap-ups in the last few days, which indicates a possibility of a reversal of price below $1,000. Price has maintained the upper region of the Bollinger bands since the beginning of the second half of the year.

On the daily chart, the market closed yesterday with a Doji after reaching a new milestone. The price might reverse to close the gap ups, which might reduce the $TSLA share again below $1,000. Price has crossed to the overbought region of the RSI, this indication might lead to a reversal.

AstraZeneca’s Share Price Reaches A New Resistance Level

$AZN share price reached a new resistance at $60.87 in July 2021, after millions of doses were rolled out across the world. As of yesterday, 40.6% of the world population has received at least one dose of a Covid-19 vaccine. There have been several cases of countries halting the use of the $AZN vaccine as a result of rare cases of blood clots. The share price of major vaccine companies like Moderna, BioNTech-Pfizer, Sinovac had a shortfall. As many companies are making it mandatory for their workers to be vaccinated, more of these vaccines will be rolled out. As many companies are beginning to return to the office, incentives were given to the workers for receiving the Covid-19 jab. Workers who fail to receive the jab might risk termination.

Companies like American Airlines, Bolthouse Farms, Dollar General, Instacart are paying workers after being vaccinated. The price of $AZN went as low as $46.38 in February of this year as several issues were raised across all vaccine manufacturing companies, majorly for blot clots. Since July, $AZN has been consolidating around the resistance at $60.83. The price might drop in the coming weeks as some workers of companies might tender resignation because the vaccines are made mandatory, which deprives them of their human rights. Since May 2021, RSI has shown three indications of the price being overbought.

Google Recently Had A Huge Gap Down

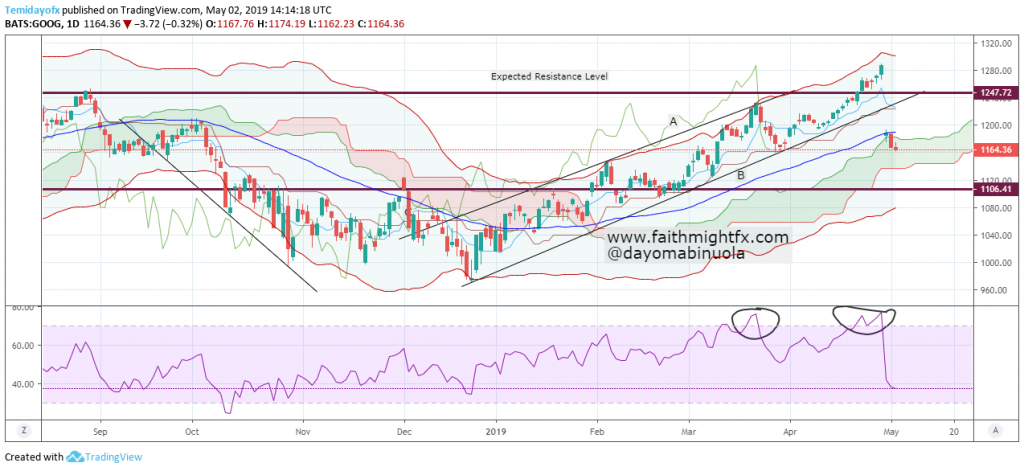
Our last analysis on Google shows the share price was going to rise. . Price was able to go beyond the expected resistance level of 1123.23. The bullish movement from last year was able to reach 1288.30 on the 29th of April 2019. At the last trading day of April, a gap down occurred which confirmed the beginning of a downtrend. RSI at two different occasions between March and April had shown overbought positions.

Google Daily Chart

Ichimoku is yet to show a reversal, but shows the $GOOG bulls are still in charge. The gap down which occurred made price of $GOOG on the Bollinger band to cross to the lower region of the chart which is presently in the Ichimoku cloud. The share price of $GOOG is currently at 1168.89. Now that price has crossed to the lower region of the Bollinger bands, this could make price to continue to fall more to 1106.41. $GOOG lost about 100points after the gap down. As we await price to continue the downward trend, it might still lose 150points more.

For Procter & Gamble, The Bulls Might Give Up Soon

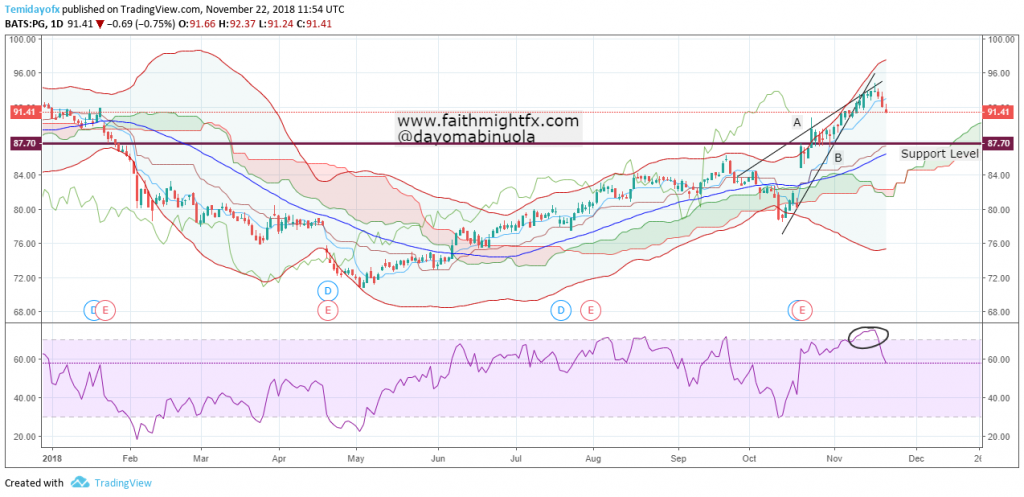
After a experiencing a huge fall early in the year, the price of $PG gained momentum for a rise in June. Since June, it has all been bullish for the $PG shares, moving over 2000points in 2018. Just two weeks ago, the price of $PG reached 94.88, the highest point in the year. Though a bearish movement occurred in the second week of October for a short while, the bulls took over again. Price is yet to be oversold due to the active roles of the bulls.

Unlike many other stocks, $PG finished October with the bulls in charge. Price is currently at 91.94. After the new high of 2018 was reached, a reversal has begun indicating a bearish move in $PG. Price is yet to cross the lower region of the Bollinger band. The Ichimoku too shows a bullish future. However, a breakout to the downside has occurred from the trendlines showing the beginning of a correction. RSI indicates an overbought position which has previously occurred at three different instances. Though $PG outperformed this year, price action now signals a consolidation period that could lead to losses.

Source: Why Procter And Gamble Is Now All The Rage On Wall Street (NASDAQ)

Hewlett Packard Might Gain Momentum Despite Trade Wars

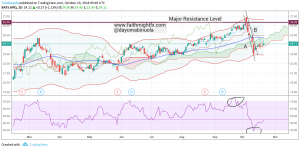
This year has been a smooth year for $HPQ holding on to a bullish trend until the first week of this month when a sharp bearish movement started. This price movement touched the resistance level and couldn’t stay above it. Price retraced itself downwards touching the middle band line, further breaking the line until price touched the lower band line. Over one week, the price of $HPQ has been in a range hoping for a breakout. $HPQ has decided to boost their presence in the printing market through innovations which could drive the share price higher.

RSI undoubtedly was overbought before the bearish movement. Now it has shown an oversold position again preparing for a bullish movement. Price is at level 23.33 and could move higher to 26.30, still maintaining the resistance level. The all-time high price in $HPQ is at the highest resistance level. Price first touched this point in July 2000.

Source: HP Upgrades Sprocket To Boost Presence In Printing Market (NASDAQ)

FB Looks Vulnerable

This is the first time that $FB has ever revisited lows on the monthly chart. Here, on the weekly, this is nothing new. The contrasting price action in these timeframes suggests that if September ends the month, and quarter, at new lows, $FB becomes very vulnerable heading into election season and the last quarter of the year.

Ever since $FB broke above $55 after a brief pullback at the then-highs, there has not been a dip that revisited after the recovery. The fact that price is not only below $200 after making the new all-time high at $218.62 back on July 25th, it is back at the previous lows. Price stands less than twenty dollars shy of those Cambridge Analytica lows of 149.02, as of this writing.

FB WEEKLY CHART

Price is also sitting on the 38.2% Fibonacci retracement. It could hold here. Or break lower. The real question becomes what do you below $149 or above $200? My answer to you: what is your timeframe?