The Netflix stock price in 2019 has been majorly characterized with a stable market price. This occurred as a result of an uptrend that began at the latter part of December 2018. Initially at the beginning of the year, when the price of $NFLX rose, it reached an overbought region on the RSI. Instead of the price of $NFLX to fall, price continued to go upward at a very slow pace. Since February, price has consistently been ranging on the daily chart between 343.81 and 382.87.
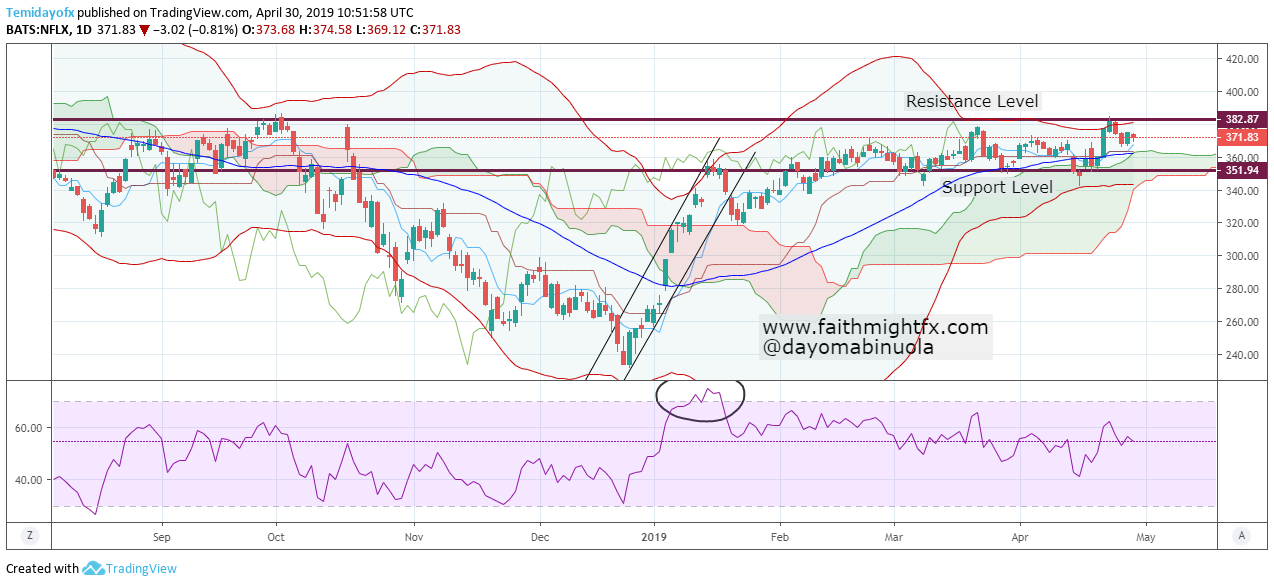
For the most part of 2019, the candlesticks have maintained the higher region of the Bollinger bands. Despite the trendlines being broken to the downside late last year, the price of $NFLX has ceased to fall. The future of Ichimoku does not show an actual direction of the market. Nevertheless, $NFLX might be losing its bull power temporarily. Price of $NFLX could fall below 351 in the coming days from its current 371.83.