fbpx

Crude Oil Price Reaches 2023 High

Crude Oil Price Reaches 2023 High

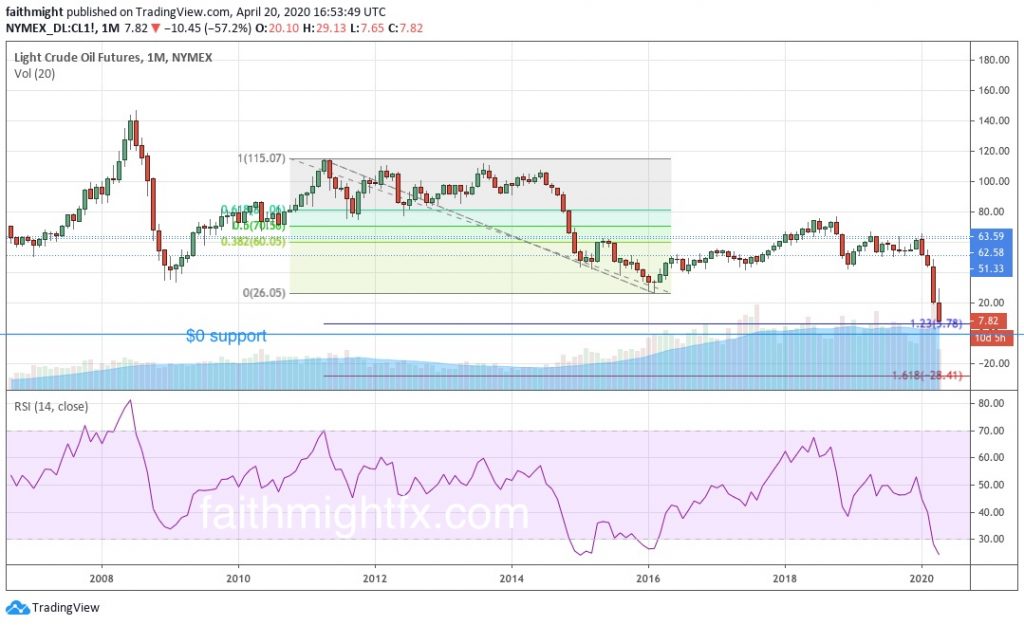
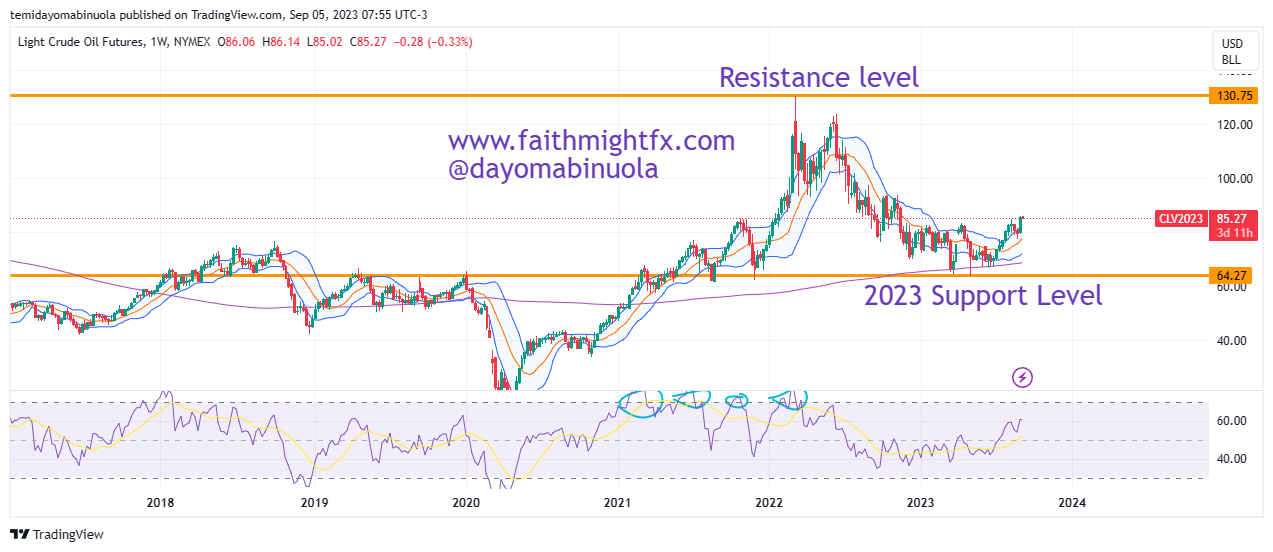
The year 2022 was not a good year for Oil investors as the downward slope that started in March 2022 continued to the end of the year. The highest price level of WTI crude oil in 2022 was at $130.75 per barrel. The last time price touched this price level was in July 2008, approximately 15years ago.

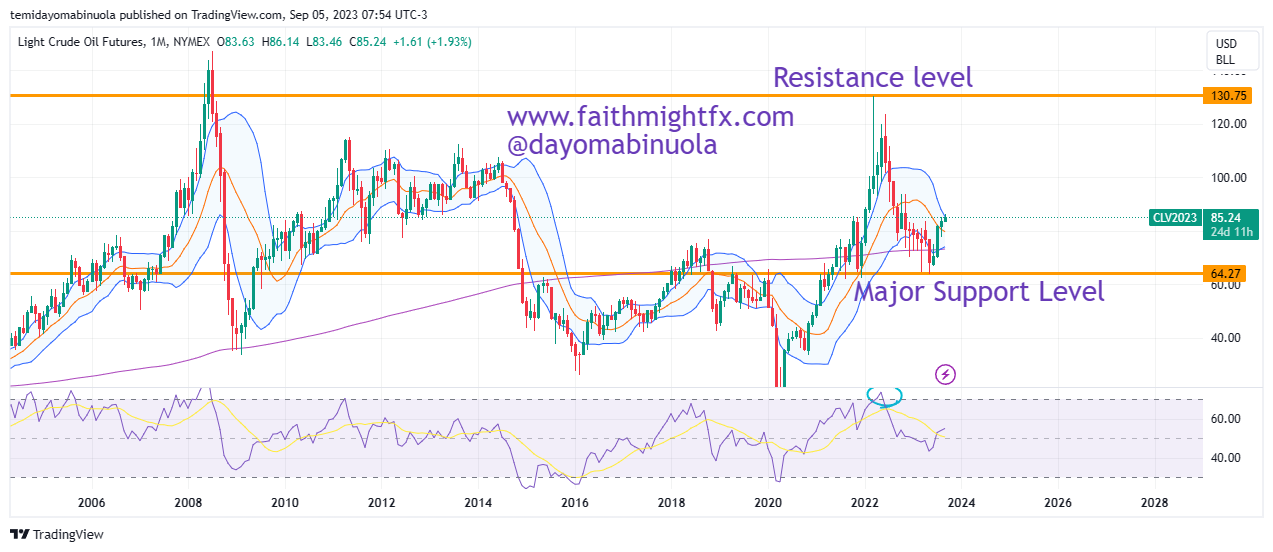
The downward slope continued in the first half of 2023. Price fell to $63.76, the lowest price since November 2021. The bulls in the second half of this year have managed to push price high from the support level of $63.75. A new 2023 high was reached last week as the WTI oil price hit $86.19, the highest price level in 10months. On the monthly chart, RSI has shown that price has been overbought but we foresee price still moving upwards. The current price of WTI crude oil is at $85.23. We see a rally to $87.65 in the coming days.

Some of these ideas are in our clients’ portfolios. To understand if this one can work for you or for help to invest your own wealth, talk to our advisors at FM Capital Group. Would you like more information on how to get commodities in your portfolio? Schedule a meeting with us here

Crude Oil Markets CRASH HARD TODAY

When oil markets crashed to $26.05 in 2015, it was the first time in my career that I had ever seen crude oil that low. It didn’t take long for prices to rally and put in what looked like a bottom. But when price didn’t retake the $100-handle 2 years later, I drew the Fibonacci retracement levels to see that the rally was actually only a correction! So I drew the Fibonacci extension levels to see where price could actually target if prices continued lower. I NEVER THOUGHT it would reach that 123% level at $5.78. NEVER. EVER. Today, we are in Never Never Land everybody wow.

So can oil prices really go negative? Because at this rate, $0 is not looking like support. And the next target is -$28.41. What a time to be alive.

[UPDATE, 4:24PM PST] Crude oil prices went negative hitting a low of -$40.32 and closed the trading day at -$37.63. UNBELIEVABLE!


If you are interested in learning how I found these levels, please check out the CHARTS101 or CHART201 course. Read the charts for your Self so you can trade what you see and not what I think.

Crude Oil Price Ready For A Boom

Globally, the crude oil price fell to 42.52 in December 2018 which occurred last in June 2017. Price of $CL_F holds a strong support at the same level. In 2018, $CL_F price maintained a resistance at level 73.43 since November 2014. All gains in 2018 were lost when a fall in price began in October. The year 2019 started on a good note for oil with the $CL_F price all bullish.

Crude Oil Daily Chart

A breakout from the trendlines has occurred giving hopes for the $CL_F bull market. At two different instances in 2018, RSI shows oversold positions. As we watch the $CL_F bulls get into the market in large numbers, price has been bullish for about 3 weeks. The price is not overbought and might not show trace of being overbought soon. There are indications that the price of $CL_F could reach 69 in a few months time or go beyond that. The Ichimoku has shown a bullish future which occurred last in November 2018. Price has crossed to the upper region of the Bollinger band indicating the bull power is dominant.