When oil markets crashed to $26.05 in 2015, it was the first time in my career that I had ever seen crude oil that low. It didn’t take long for prices to rally and put in what looked like a bottom. But when price didn’t retake the $100-handle 2 years later, I drew the Fibonacci retracement levels to see that the rally was actually only a correction! So I drew the Fibonacci extension levels to see where price could actually target if prices continued lower. I NEVER THOUGHT it would reach that 123% level at $5.78. NEVER. EVER. Today, we are in Never Never Land everybody wow.
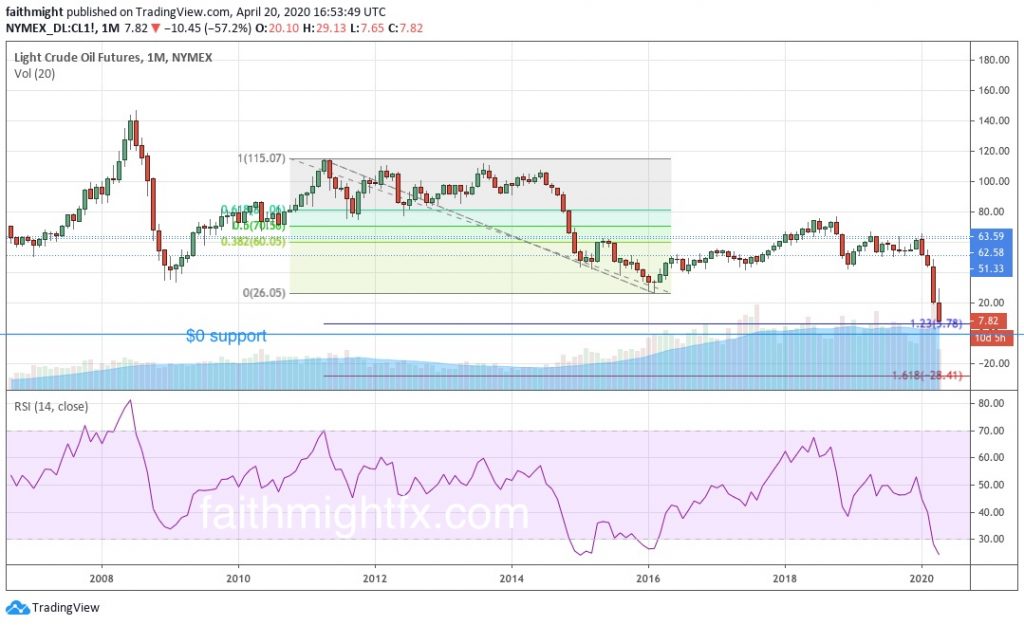
So can oil prices really go negative? Because at this rate, $0 is not looking like support. And the next target is -$28.41. What a time to be alive.
[UPDATE, 4:24PM PST] Crude oil prices went negative hitting a low of -$40.32 and closed the trading day at -$37.63. UNBELIEVABLE!
If you are interested in learning how I found these levels, please check out the CHARTS101 or CHART201 course. Read the charts for your Self so you can trade what you see and not what I think.