fbpx

Against All Odds, SPX Hits A New High

S&P 500 was founded 66 years ago. It is traded in 3 exchanges including NYSE and NASDAQ. The S&P 500 is used to track the best 500 traded companies in the United States. The market capitalization of S&P 500 as of December 29, 2023, was $42 trillion. SPX made a historical move from the lockdown low of $2196.55 to the previous high at $4864.61. That was an over 120% increase in a 2-year bullish run.
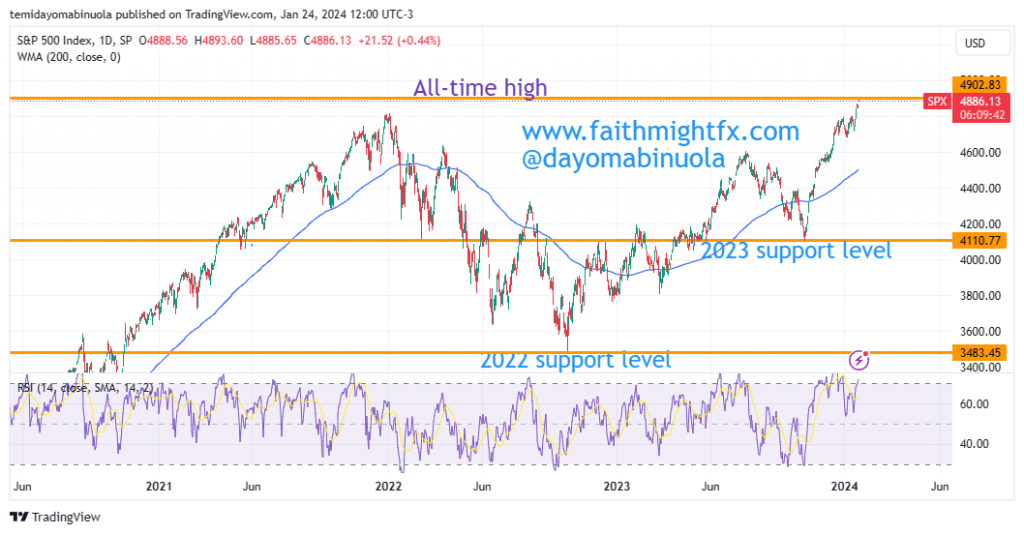
This month makes it two years the S&P 500 price hit a new high. A breakout to the upside occurred on the 19th of January which has made SPX’s price hit a new high at $4865, the rally has continued as SPX continues to hit new highs as price is currently at $4,891.
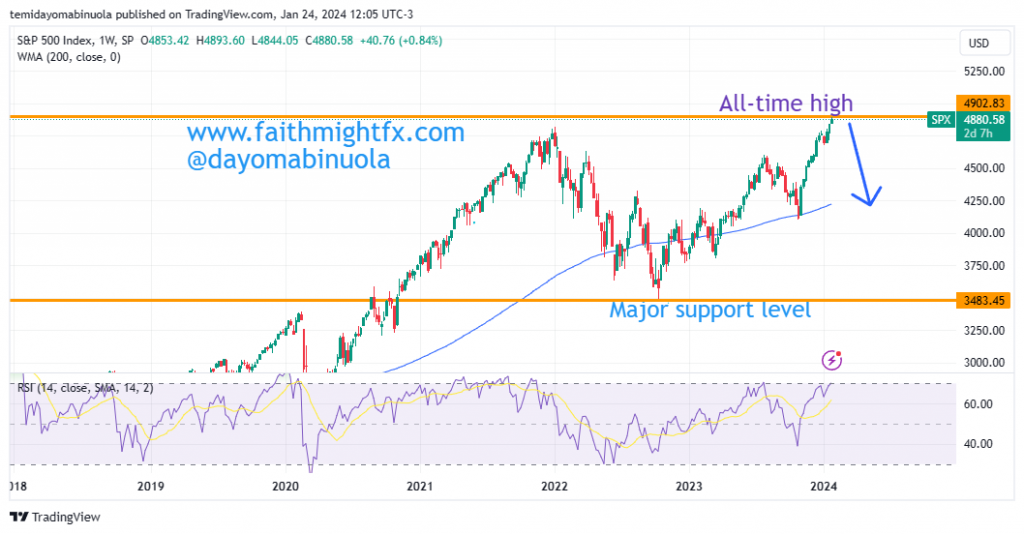
The bullish momentum for SPX might be cut short soon as the bears might push price lower to $4133. On the daily chart, RSI has shown the price has been overbought multiple times since November 2023. As a result of the new high in January 2023, the RSI has hit the overbought position.

Some of these ideas are in our clients’ portfolios. To understand if this one can work for you or for help to invest your own wealth, talk to our advisors at FM Capital Group. Would you like more information on how to get stock indicies in your portfolio? Schedule a meeting with us here

Tesla’s Share Price Dips to Previous Month’s Low

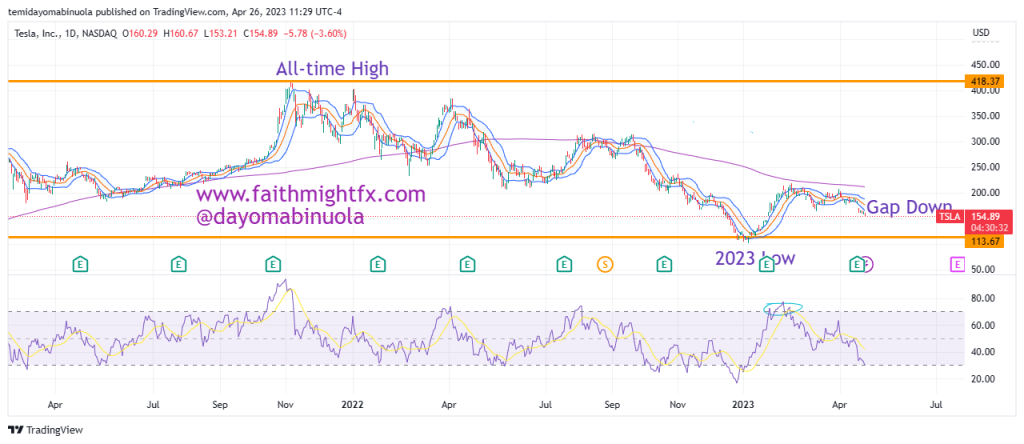
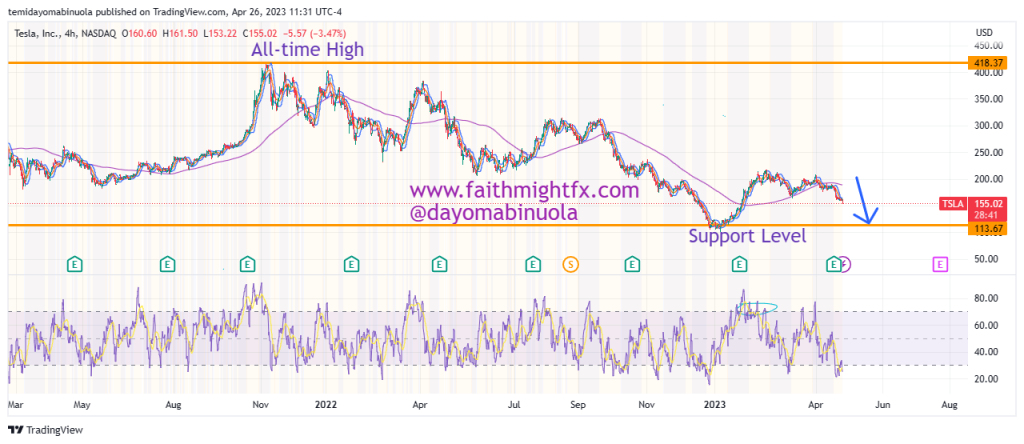
From the all-time of Tesla in November 2021 at $418 per share, the $TSLA share price has been falling in value. All investments made at the beginning of 2022 ended in negative figures due to the one year plus bearish trend. Despite the bearish trend in the market, Tesla made a revenue of US$81.46billion in 2022.

Despite the bearish trend of 2022, price of $TSLA was beginning to rally in 2023. with the price bouncing from the 2022 support level of $101 to the 2023 high of $218. In recent weeks the bears have pushed price to $155 and this could continue for some time.

On Thursday the 20th of April, 2023, the tesla share price opened with a gap down at $166. The lowest in the previous month was $164. The price on that Thursday closed at $163.04, a little bit lower that the March 2023 lowest price. Since the gap down, the bulls have failed to make a turnaround in the price as the price keeps falling.

ON the 4hr chart, RSI showed that price had been overbought at two different times in March and currently shows that price has been oversold once in April. We might be falling to $113 in the coming weeks.

Some of these ideas are in our clients’ portfolios. To understand if this one can work for you or for help to invest your own wealth, talk to our advisors at FM Capital Group. Would you like more information on how to get stocks in your portfolio? Schedule a meeting with us here

Microsoft Share Price Reaches 2023 High

Microsoft Share Price Reaches 2023 High

Microsoft is an American company that develops and distributes software and services such as a search engine (Bing), cloud solutions and the computer operating system, Windows. As of April 2023, Microsoft has a market cap of $2.129 Trillion. This makes Microsoft the world’s second most valuable company by market cap. According to Microsoft’s latest financial reports the company’s current revenue is $204.09 billion. In 2021, the company made a revenue of $184.90 billion which was higher than that of 2020 at $153.28 billion.

Last year was not so good for $MSFT after price dipped from the year’s high at $326 and closed at $238. There seems to be a bit of hope as Microsoft share price has rallied and it is about to reclaim the $300 threshold. Price currently stands at $286.89.

On the 6th of April, Microsoft’s share price reached $292, making it the highest point that Microsoft’s share price has reached in 2023. The stocks of several tech firms are currently appreciating, which is reflected in the S&P 500. Our analysts see Microsoft’s share price reclaiming the $300 pyschological level in the coming weeks.

Some of these ideas are in our clients’ portfolios. To understand if this one can work for you or for help to invest your own wealth, talk to our advisors at FM Capital Group. Would you like more information on how to get stocks in your portfolio? Schedule a meeting with us here

SPX Continues To Rebound

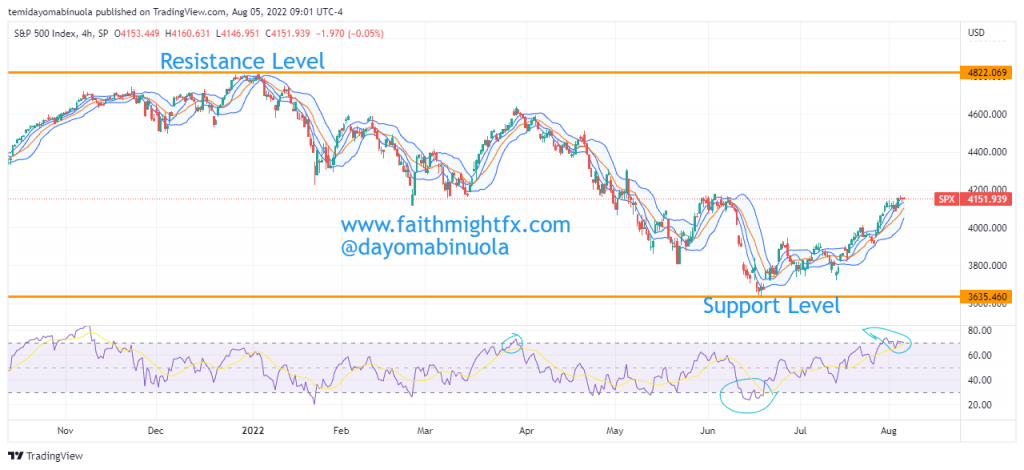
In the second trading day of January 2022, SPX hit $4800 which is the all-time high. Afterwards, SPX experienced lower lows and lower highs which resulted in a fall in price to the 2022 low of $3635 in mid-June 2022. While SPX fell between January and June, it established a couple of resistance levels with the last resistance level before the year’s low being at $4179 which was in the beginning of June.

4hr Chart

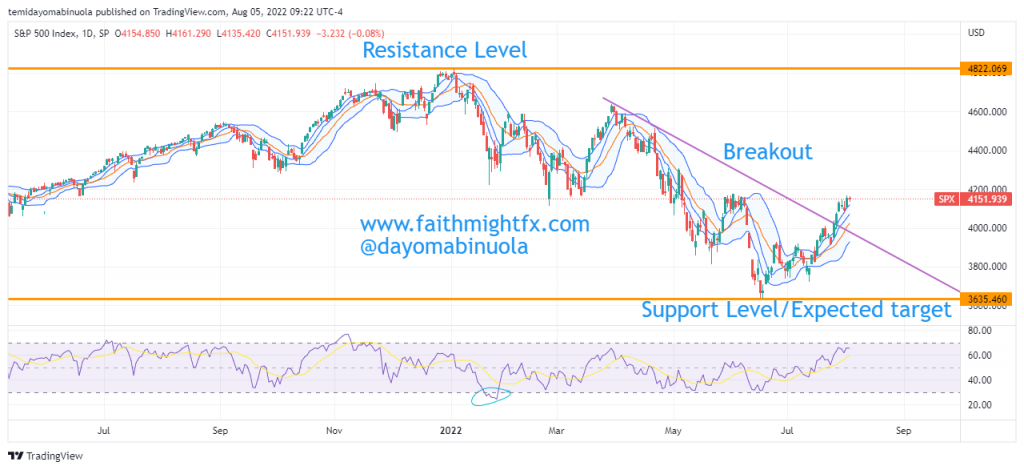
Since the 2022 current low of SPX which was reached in June at $3635, the price of SPX has continued to rally. This rally has taken the price above the $4000 psychological level. In the last 5 trading days, the price of SPX has been able to close above $4000 as the current price is at $4152. A breakout from the June resistance level may occur and price could reach $4200 but this is not guaranteed. 

Daily Chart

The reason why the upside movement of SPX can’t be guaranteed is because the momentum on the bulls is waning. On the flip side, whether price reaches $4200 or not, the bears might eventually take over and push price below the current low and a new low might be formed below $3635 as RSI is currently showing that price is overbought on the 4H timeframe.

Some of these ideas are in our clients’ portfolios. To understand if this one can work for you or for help to invest your own wealth, talk to our advisors at FM Capital Group. Would you like more information on how to get stocks indices in your portfolio? Schedule a meeting with us here