fbpx

SPX Likely To Dip To Previous Support Level

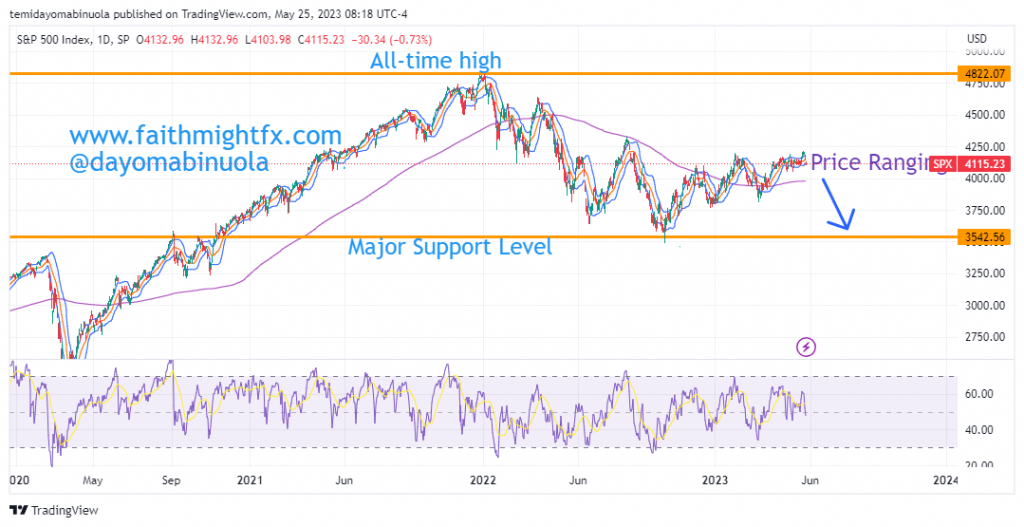
The Standard and Poor’s 500 commonly known as SPX or S&P 500 is a stock market index that was founded 66 years ago. It is one of the most commonly followed equity indices. As of December 31, 2020, more than $5.4 trillion was invested in assets tied to the performance of the index. As of December 31, 2022, the market cap of SPX was at $33trillion. Since SPX was launched on the stock exchange in 1972 at $4.49, the index has been on a long-term bullish run. Each time a correction occurs on the monthly chart, the price of SPX reaches a new high. The all-time high of SPX is $4,822 which was hit in January 2023.
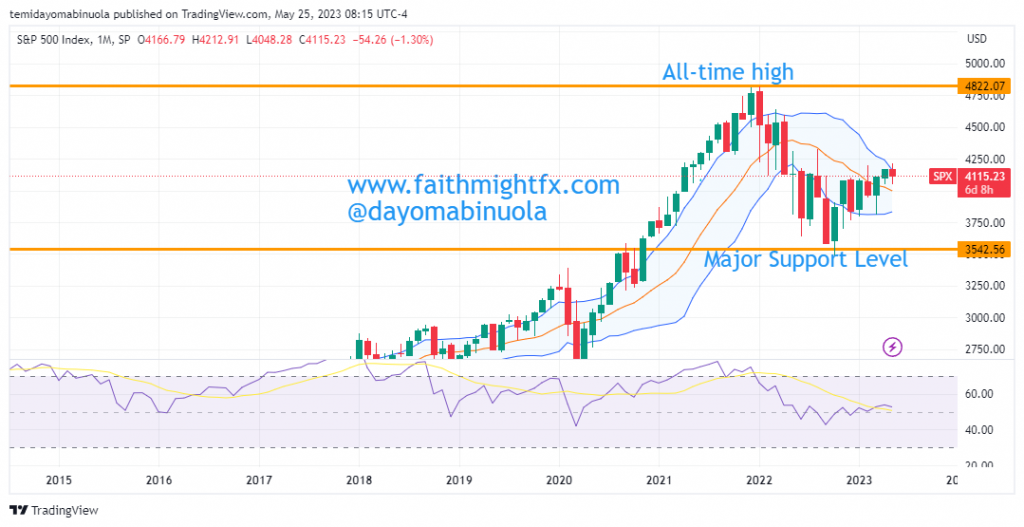
The opening price of SPX in 2022 was $4,777 and closed at $3,825. The stock index had a woeful 2022. 2023 has been bullish with SPX opening for the year at $3,856. 2023’s high was hit this month at $4,215. The support level of SPX in 2022 was $3,497. In the coming weeks, we might see the price of SPX fall to $3,497 from the current price ranging a little bit above $4,000. As of the time the article was written, the price is at $4,115.23.
Some of these ideas are in our clients’ portfolios. To understand if this one can work for you or for help to invest your own wealth, talk to our advisors at FM Capital Group. Would you like more information on how to get stock indices in your portfolio? Schedule a meeting with us here

S&P 500 Bounces From 2022 Support Level

S7P 500 bounces from Support Level

For about two years, between March 2020 and January 2022, SPX was in a bullish marathon. The support level as of March 2020 was $2210. The rally peaked at $4822 in January 2022. This price stands as the all-time high for the stock index.

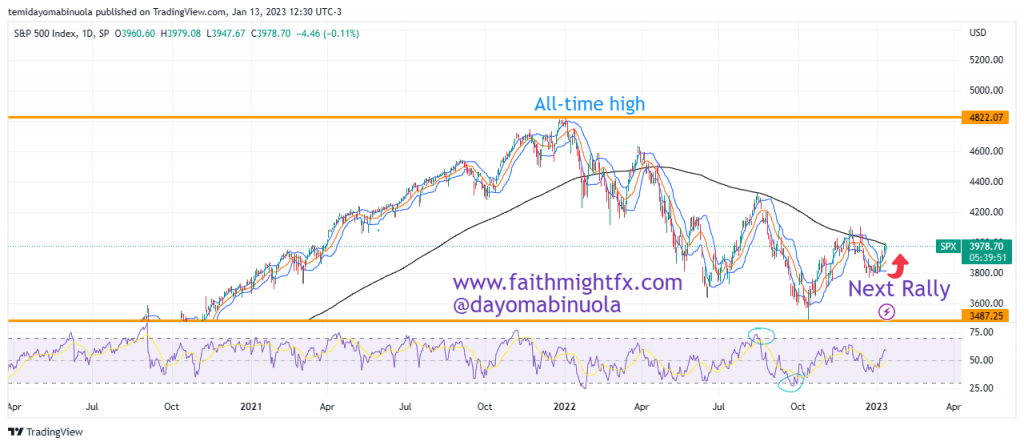
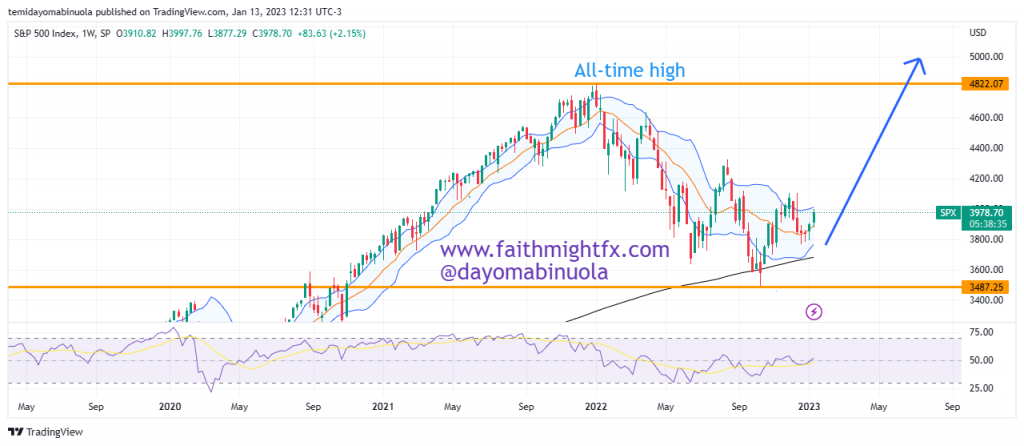
Despite price reaching the all-time high in 2022, last year was a bad year for SPX investors as price went as low as $3488 in October 2022 as a result of the bearish turn. That low was 2022’s support level. 2023 has shown a bit of hope as there has been a bounce from 2022’s close of $3833. SPX opened in 2023 at $3845 and is currently at $3969.

Daily Chart

On the daily chart, RSI indicates that price was oversold as of October 2022. This might be the reason for the recent rally. This oversold position may be able to create a bullish force that in the long run can push SPX above the all-time high thereby creating a new all-time high. However, in the short term, we might be seeing price rally above $4200 in the coming weeks.

Weekly Chart

Some of these ideas are in our clients’ portfolios. To understand if this one can work for you or for help to invest your own wealth, talk to our advisors at FM Capital Group. Would you like more information on how to get stock index in your portfolio? Schedule a meeting with us here
Etsy Dips To A New Low


Etsy is an American Vintage e-commerce company focused on handmade and vintage items and craft supplies. Etsy was founded 16 years ago and went public about 7 years ago at $16. On the day of the IPO, the share price rose by 72%. After 9 months of its launch on the stock exchange, it took a bearish turn and hit an all-time low at $6.04.


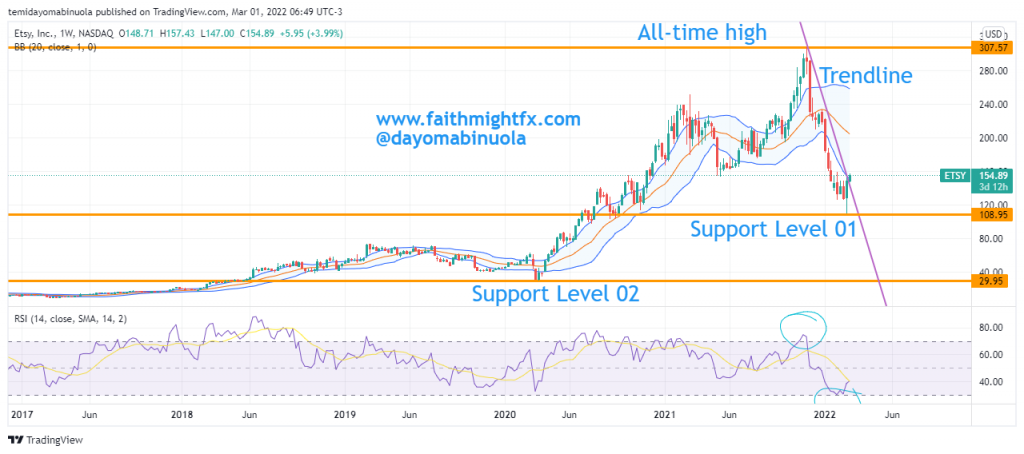
From January 2016, $ETSY share price took off in the bullish wave. In November 2021, Etsy’s price reached a new all-time high at $308.96. That high reflected on the RSI as an “overbought” indication. Following that all-time high, the share price fell and so far, the share price has lost 65% of the price of the all-time in November 2021. The most recent price dip did not indicate oversold on the RSI despite the 65% fall in price. The crisis between Russia and Ukraine has not really affected the US stocks as $ETSY has been appreciating from the new low at $108.53 for the past two weeks. This appreciation could lead to a long-term rally that could see $ETSY gaining 100 points.

Some of these ideas are in our clients’ portfolios. To understand if this one can work for you or for help to invest your own wealth, talk to our advisors at FM Capital Group. Would you like more information on how to get stocks and commodities in your portfolio? Schedule a meeting with us here.

SPX Might Lose Its Bullish Strength Temporarily

SPX is an American index based on 500 large companies listed on NYSE and NASDAQ exchanges. Many regard it as a haven. Many of the stocks in the SPX have reached new all-time highs in the last decade. Companies like Apple Inc, Amazon, General Electric, Facebook, Microsoft, Alphabet, Tesla, and many more are listed in the S&P 500. The market capitalization of SPX is valued at $38.2trillion as of June 30, 2021. S&P 500 has been on a long-term bullish trend over the last decade with only a few corrections. The most recent correction occurred during the pandemic, after which price continued the upward movement. The price of SPX in the year 2010 was at $1111.43, SPX’s price today is at $4,448.07, that’s about 4X over the last decade.

The all-time high price of SPX was at $4480.11 on the 16th of August. In April and July of this year, SPX shows that price has been overbought in the two instances. A correction to the downside might occur as stocks are beginning to fall in the past few days due to increasing cases of Covid-19. Price is currently consolidating at the upper region of the Bollinger bands. The next expected support could be at $4,212 i.e.SPX might lose about 300 points in the coming weeks.