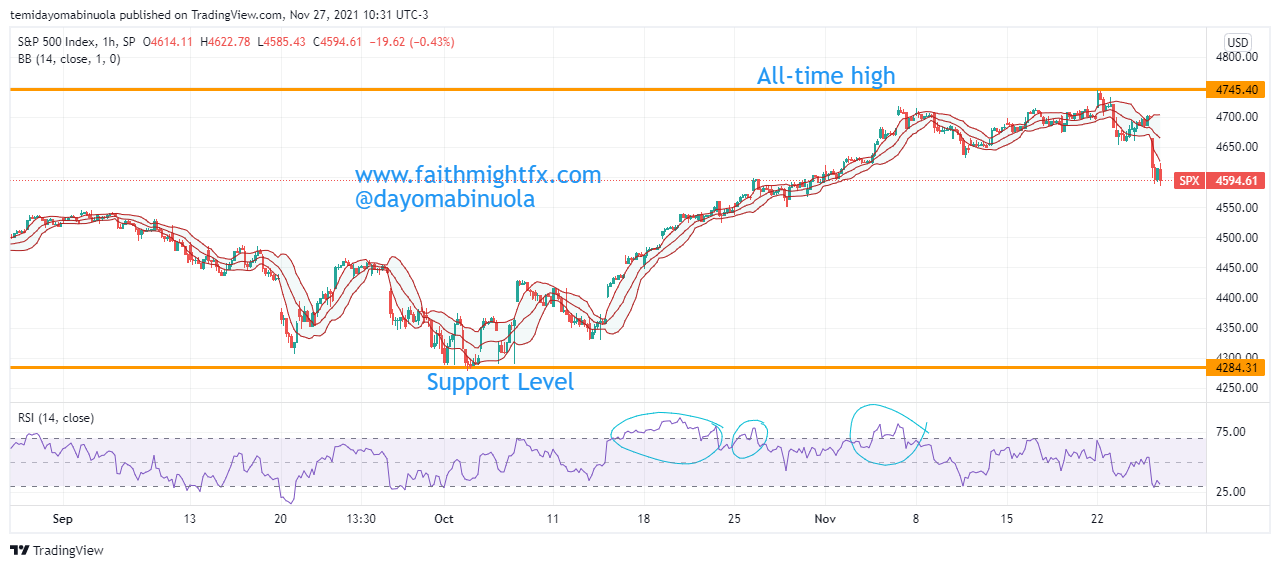
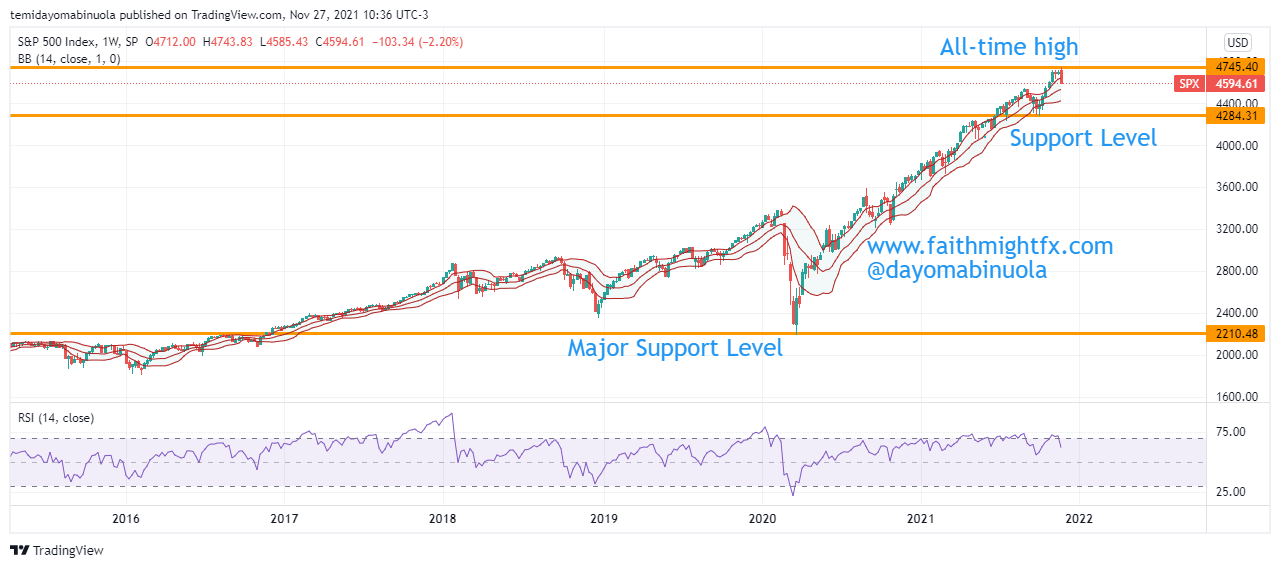
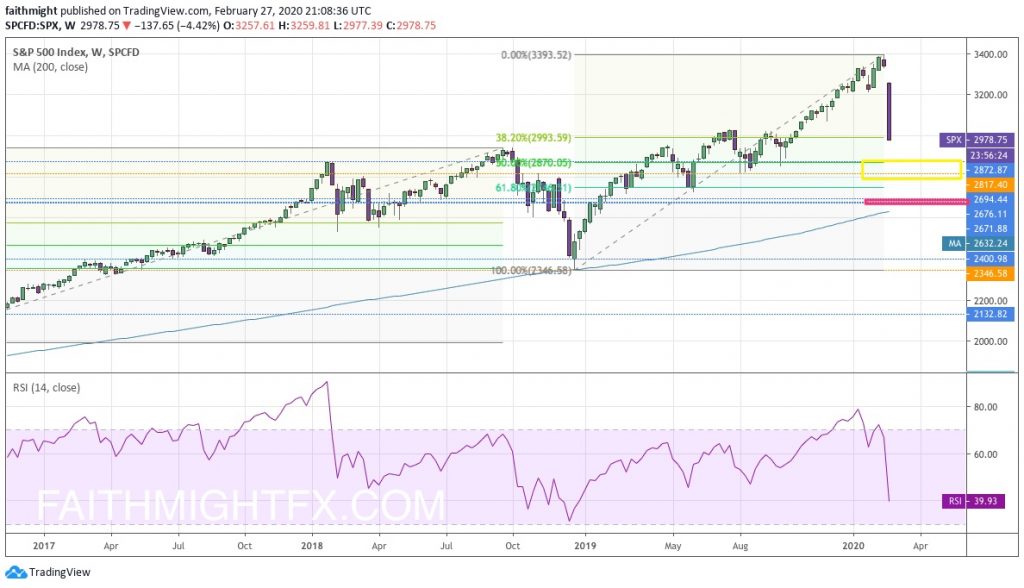
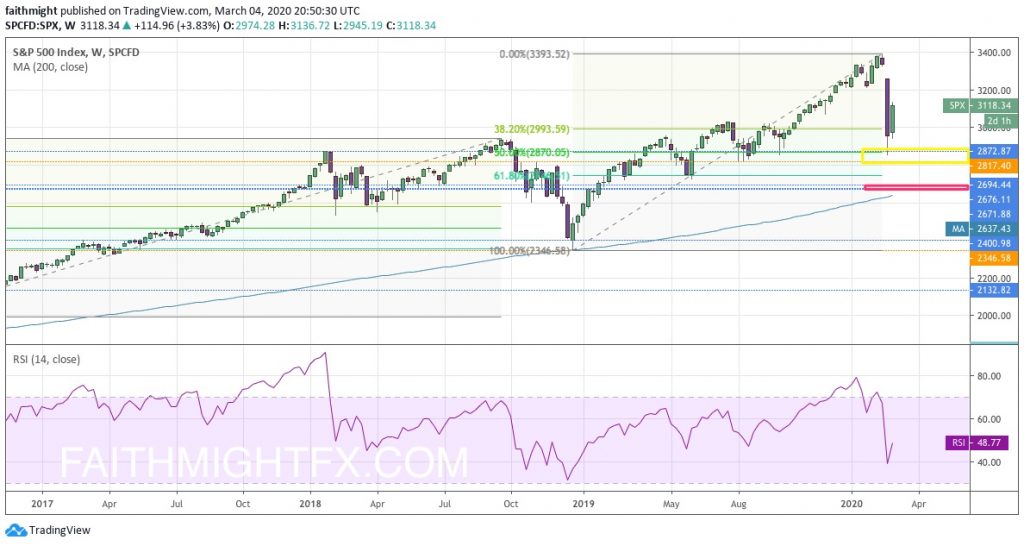
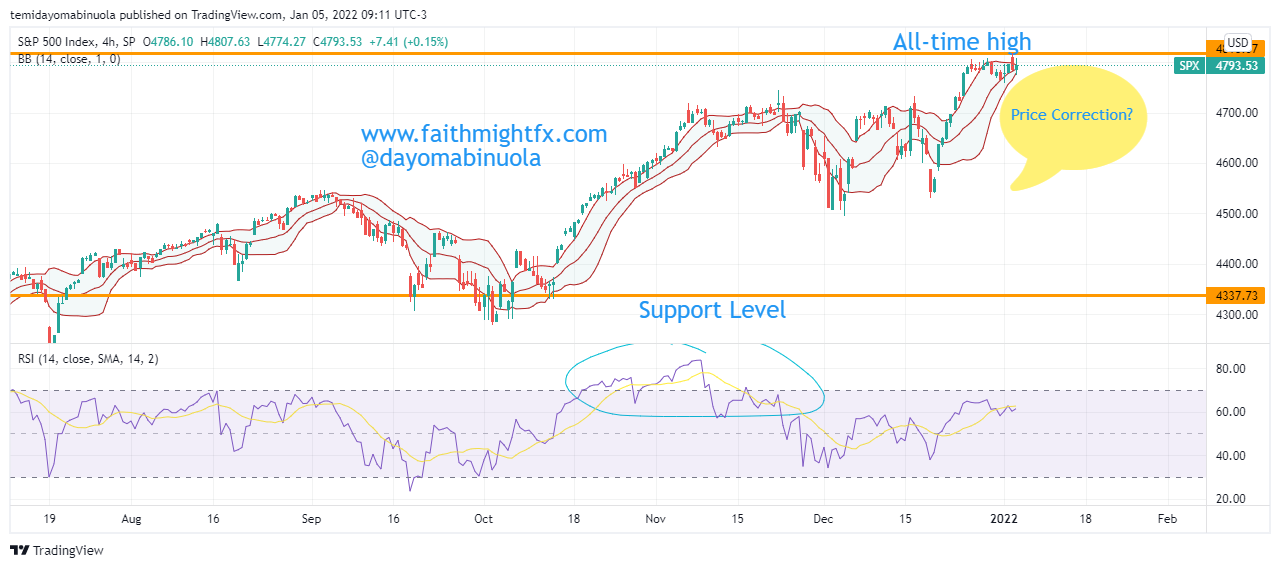
In our November article on S&P 500, the price had a correction as our analysts forecasted that $SPX could reach a new all-time high at $4800. The $4800 forecasted price was surpassed as the most recent all-time high is at $4824.53. Many stocks in the SPX appreciated around this time. SPX has been able to make 1X since the pandemic lowest price at $2210. The current price of SPX is $4793.53 after the price closed yesterday lower than the all-time high at $4824.53.
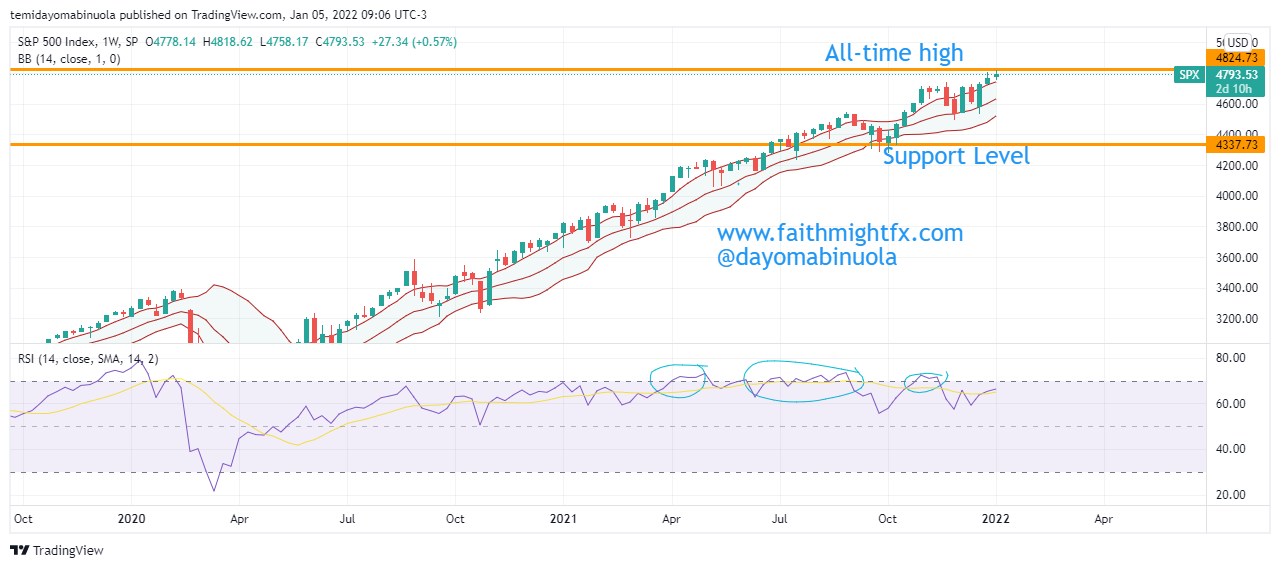
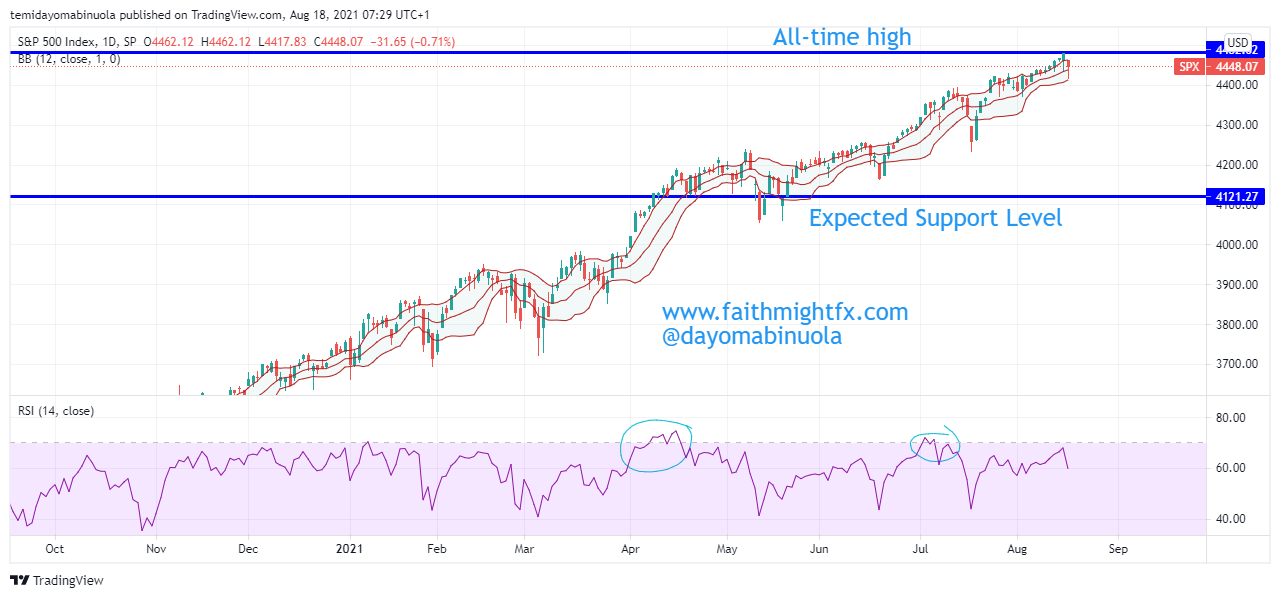
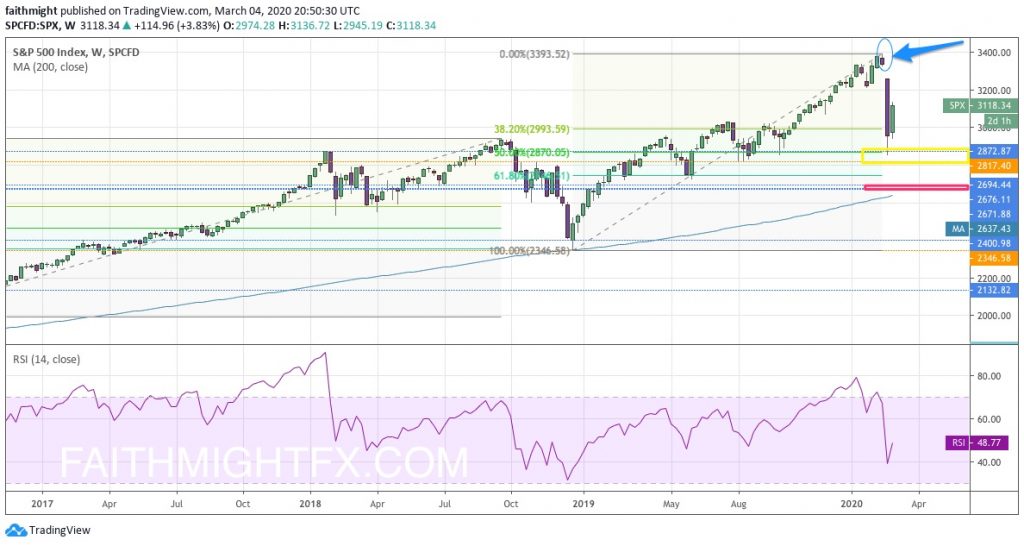
The new variant of the coronavirus named ‘IHU’ detected in France might likely pose a threat to the index, which might lead to a price fall. A sell-off might occur which could make the price of SPX fall to $4384.23. Despite the new all-time highs in the past months, SPX on the RSI has shown that price has been overbought multiple times since April 2021.
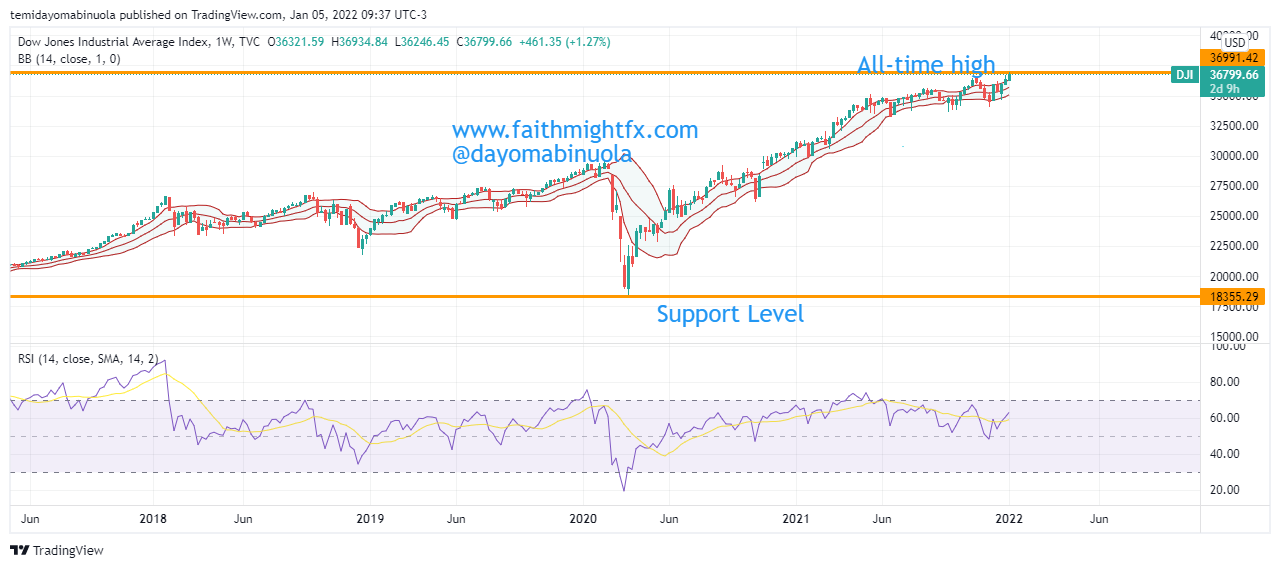
Dow Jones on the other hand made almost 1X the pandemic low at $18366. The Dow Jones recorded a new all-time high yesterday, being the second trading day of the year. There is no indication of a possible reversal. Early in December, our analysts forecasted the Dow Jones to reach a new all-time high. The new all-time was reached yesterday at $37,000. A correction might take place.
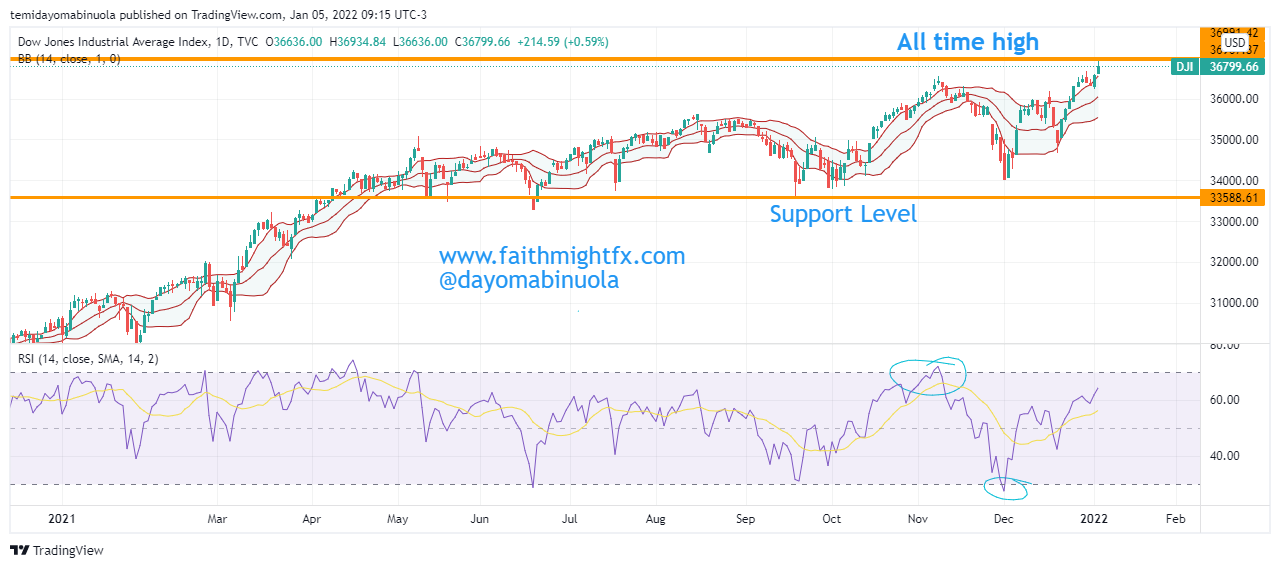
As SPX had a price fall on the second trading day of the year, Dow Jones extended its rally to a new all-time high at $37,000. The only threat to the continuous rally of the $DJI could be the new variant ”IHU’, which health officials found it has 46 mutations. These mutations are more than the omicron. The price still maintains the upper region of the Bollinger bands. The $DJI might continue its rally for the next few days or weeks.
Some of these ideas are in our clients’ portfolios. To understand which ones can work for you or for help to invest for your own wealth, talk to our advisors at FM Capital Group. Would you like more information on Investment Advisory, Portfolio Services, and VC? Schedule a meeting with us here.